Investment Thesis
In one of my recent articles, I conducted a comprehensive risk-analysis on the current composition of The Dividend Income Accelerator Portfolio.
In that analysis, I highlighted the strengths of The Dividend Income Accelerator Portfolio, such as its extensive diversification over companies, sectors and industries as well as its geographical diversification, which contribute to a reduced concentration risk and a reduced overall risk level.
I further showcased that its reduced risk level is achieved through the inclusion of companies that exhibit low Beta Factors, low Payout Ratios and attractive EPS Growth Rates.
However, I also identified some weaknesses of the current composition. The primary weakness of The Dividend Income Accelerator Portfolio has been its large exposure to the Financial Sectors, which implies an elevated sector-specific concentration risk.
Even though I explained in this previous article that I see this sector-specific concentration risk to be significantly less relevant for long-term-investors, the recent portfolio incorporations of BHP Group (NYSE:BHP) and Microsoft (NASDAQ:MSFT) have been made to decrease the risk.
At the same time, their incorporations help to increase the portfolio’s exposure to the Materials Sector and to the Information Technology Sector and therewith to increase the portfolio’s level of diversification.
In addition to that, it can be highlighted that, through their incorporation, the 5 Year Weighted Average Dividend Growth Rate [CAGR] of the portfolio has been raised from 9.03% to 9.12%, while the 5 Year Weighted Average Dividend Yield [TTM] has been decreased from 4.69% to 4.56%.
Before I dive deeper into the presentation of the two selected companies, I would like to briefly explain the characteristics of The Dividend Income Accelerator Portfolio.
Those who are already familiar with the portfolio, can skip the following section written in italics.
The Dividend Income Accelerator Portfolio
The Dividend Income Accelerator Portfolio’s objective is the generation of income via dividend payments, and to annually raise this sum. In addition to that, its goal is to attain an appealing Total Return when investing with a reduced risk level over the long term.
The Dividend Income Accelerator Portfolio’s reduced risk level will be reached due to the portfolio’s broad diversification over sectors and industries and the inclusion of companies with a low Beta Factor.
Below you can find the characteristics of The Dividend Income Accelerator Portfolio:
- Attractive Weighted Average Dividend Yield [TTM]
- Attractive Weighted Average Dividend Growth Rate [CAGR] 5 Year
- Relatively low Volatility
- Relatively low Risk-Level
- Attractive expected reward in the form of the expected compound annual rate of return
- Diversification over asset classes
- Diversification over sectors
- Diversification over industries
- Diversification over countries
- Buy-and-Hold suitability
BHP Group
BHP Group is a company from the Diversified Metals and Mining Industry that was founded in 1851. Presently, the company has a Market Capitalization of $159.14B and employs 49,089 people.
BHP Group has shown a negative performance of -1.49% within the past 12-month period.
Source: Seeking Alpha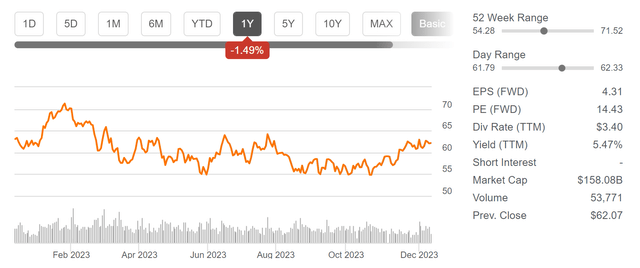
BHP Group’s Competitive Advantages
Among BHP Group’s competitive advantages is its strong financial health, reflected by the company’s EBIT Margin [TTM] of 39.83%, Return on Common Equity of 29.44%, and A1 credit rating from Moody’s.
Another key strength is its broad and diversified product portfolio, encompassing operations in the Copper, Iron Ore, and Coal segments, allowing the company to spread its risk.
Additionally, it can be highlighted that BHP Group’s large economies of scale enable greater cost efficiency when compared to smaller competitors.
BHP Group’s Valuation
In terms of Valuation, it can be highlighted that the company has a P/E [FWD] Ratio of 12.88, which is 21.93% below the Sector Median and 2.64% below its average from the past 5 years (which is 13.23). Both metrics indicate that BHP Group is presently undervalued. These metrics underline my belief that BHP Group has been an attractive addition to The Dividend Income Accelerator Portfolio.
BHP Group’s Strong Profitability
It can be further highlighted that BHP Group is an excellent pick in terms of Profitability: the company exhibits an EBIT Margin [TTM] of 39.83%, which stands significantly above the Sector Median of 11.38%.
The company’s strength in terms of Profitability is further evidenced by its Return on Common Equity [TTM] of 28.89%, which also stands well above the Sector Median of 7.61%.
Below you can find the Seeking Alpha Profitability Grades for BHP Group, which further underscore the company’s strong financial health.
Source: Seeking Alpha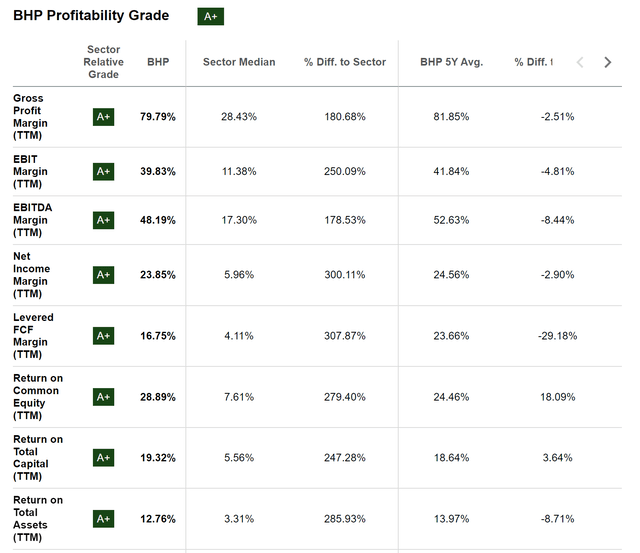
When compared to competitors such as Rio Tinto (NYSE:RIO) and Vale (NYSE:VALE), BHP Group’s superiority in terms of Profitability can be seen: while BHP Group exhibits an EBIT Margin [TTM] and Return on Common Equity of 39.83% and 29.44%, Rio Tinto’s are 27.28% and 15.53%, and Vale’s are 34.91% and 26.77% respectively.
BHP Group’s Dividend and Dividend Growth
Presently, BHP Group pays shareholders a Dividend Yield [FWD] of 5.12%, indicating that investors will have the ability to generate a significant amount of extra income via dividend payments.
At the same time, it can be highlighted that the company has shown a 10 Year Dividend Growth Rate [CAGR] of 5.09%, suggesting that it could be able to raise this dividend at an attractive growth rate within the following years.
This combination of dividend income and dividend growth makes BHP Group an excellent addition to The Dividend Income Accelerator Portfolio, aligning with the portfolio’s investment approach.
However, it should be mentioned that I do not consider the company’s dividend to be entirely safe. BHP Group presently exhibits a Payout Ratio [FY1] [Non GAAP] of 52.41%.
Therefore, I do not have plans to overweight BHP Group within The Dividend Income Accelerator Portfolio over the long term. A possible dividend cut could have a strong negative impact on the company’s stock price.
With my plans to underweight BHP Group in The Dividend Income Accelerator Portfolio over the long term, we maintain a reduced risk level for the overall portfolio, increasing the likelihood of achieving favorable investment results.
The Projection of BHP Group’s Dividend and Yield on Cost
The graphic below illustrates a projection of the company’s Dividend and Yield on Cost when assuming an Average Dividend Growth Rate of 3% for the following 30 years (which is a conservative assumption, since the company’s 5 Year Dividend Growth Rate [CAGR] stands at 5.09%).
Source: The Author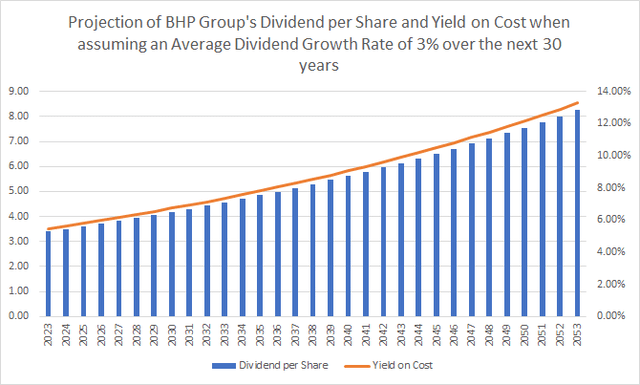
When assuming this Average Dividend Growth Rate of 3% for the following 30 years, you could potentially reach a Yield on Cost of 7.36% in 2033, 9.89% in 2043, and 13.30% in 2053.
The chart further underscores that BHP Group is an excellent choice for The Dividend Income Accelerator Portfolio, aligning with the portfolio’s investment approach of blending dividend income and dividend growth.
Microsoft
Microsoft develops and distributes on a global basis software, services, devices and solutions. The company was founded in 1975 and has about 221,000 employees at this moment in time.
Despite Microsoft’s impressive performance of 51.27% over the past 12 months, I still consider the company to be fairly valued, as I will demonstrate in the Valuation Section of this analysis.
Source: Seeking Alpha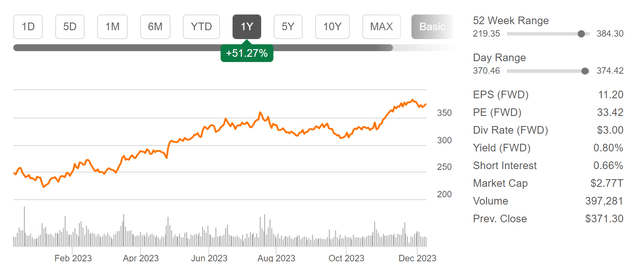
Microsoft’s Competitive Advantages
Among Microsoft’s competitive advantages is its broad and diversified product portfolio. This includes its Windows operating system, Office products, Cloud computing platform Azure, as well as the LinkedIn platform.
Another competitive advantages is its strong financial health, reflected in an Aaa credit rating from Moody’s, its EBIT Margin [TTM] of 43.01% and Return on Common Equity of 39.11%, providing the company with an additional edge over financially less healthy competitors.
Additional competitive advantages of the company include its strong brand image, its own eco-system, large customer base, and strong position within the cloud computing market.
Microsoft’s Valuation
Despite Microsoft’s P/E [FWD] Ratio of 33.25, I consider the company to be fairly valued at this moment in time. My opinion is based on the fact that Microsoft’s current P/E [FWD] of 33.25 is only slightly above its average from the past 5 years (30.03). Microsoft’s Price/Sales [FWD] Ratio of 11.36 is also only slightly above its average from the past 5 years (which is 9.79), further confirming the company’s fair Valuation.
In addition to that, it can be highlighted that Microsoft exhibits excellent growth metrics, which further underline my investment thesis that the company is currently fairly valued. Microsoft has an EPS Diluted Growth Rate [FWD] of 10.08%, which stands significantly above the Sector Median of 7.02%.
Microsoft’s Strong Profitability
In terms of Profitability, it can be highlighted that Microsoft exhibits a Gross Profit Margin [TTM] of 69.44% and an EBIT Margin [TTM] of 43.01%, both of which stand significantly above the Sector Median of 48.67% and 4.78%, respectively.
Microsoft’s strong Profitability is further reflected in the company’s Return on Common Equity of 39.11%, which is well above the Sector Median of 1.13%.
The Seeking Alpha Profitability Grade, which you can find below, additionally underscores Microsoft’s financial health and its excellent competitive position within the Systems Software Industry.
Source: Seeking Alpha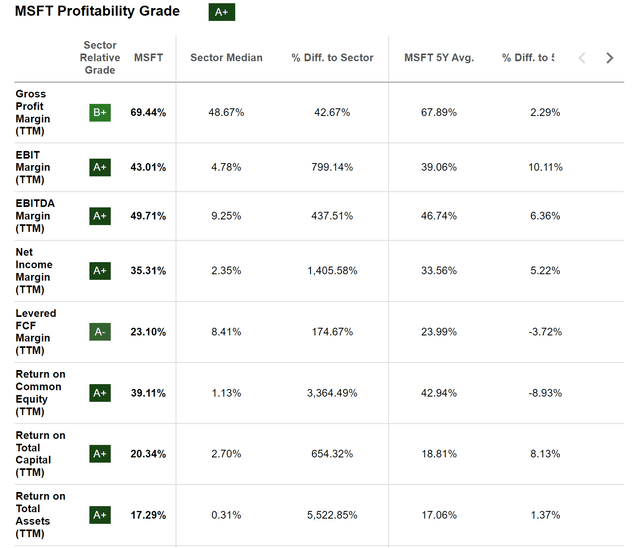
Microsoft’s Dividend and Dividend Growth
Microsoft’s current Dividend Yield [FWD] stands at 0.81%. The company exhibits a Payout Ratio of 26.70%, which indicates strong potential for future dividend enhancements, particularly when considering its growth outlooks.
Moreover, Microsoft has shown a Dividend Growth Rate [CAGR] of 11.14% over the past 10 years, which further demonstrates the company’s potential to increase its dividend at attractive growth rates in the years ahead. This potential is further underlined by Microsoft’s 5 Year Average EPS Diluted Growth Rate [FWD] of 16.10%.
These metrics underline that Microsoft could be an important position to ensure an attractive dividend growth rate of The Dividend Income Accelerator Portfolio in the coming years.
The Projection of Microsoft’s Dividend and Yield on Cost
In the chart below, you can see a projection of Microsoft’s Dividend and Yield on Cost when assuming an Average Dividend Growth Rate [CAGR] of 8% for the following 30 years (this is a conservative approach, considering the company’s 5 Year Dividend growth Rate [CAGR] of 10.16%).
Source: The Author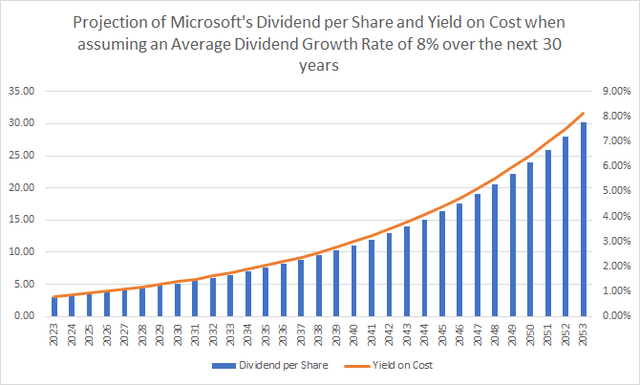
Considering this Dividend Growth Rate of 8% for the following 30 years, you could potentially achieve a Yield on Cost of 1.74% in 2033, 3.77% in 2043, and 8.13% in 2053.
Why BHP Group and Microsoft Align With the Investment Approach of The Dividend Income Accelerator Portfolio
- Both companies have strong competitive advantages and an excellent position within their industry (reflected in their strong Profitability metrics), aligning with the objective of The Dividend Income Accelerator Portfolio to preserve capital above all.
- Both BHP Group and Microsoft are financially healthy, reflected in their A1 (BHP Group) and Aaa (Microsoft) credit rating by Moody’s, their EBIT Margins [TTM] of 39.83% and 43.01%, and their Return on Common Equity [TTM] of 28.89% and 39.11% respectively. These metrics indicate that both companies align with the strategy of The Dividend Income Accelerator Portfolio to invest in financially healthy companies.
- The companies’ P/E [FWD] Ratios of 12.88 (BHP Group) and 33.25 (Microsoft) are in line with their average over the past 5 years (12.23 and 30.03 respectively), indicating that both are currently fairly valued. This matches the investment approach of The Dividend Income Accelerator Portfolio to include companies that are undervalued or at least fairly valued, providing investors with a margin of safety.
- With a Dividend Yield [FWD] of 5.12%, BHP Group particularly contributes to raising the Weighted Average Dividend Yield of The Dividend Income Accelerator Portfolio while Microsoft contributes to increasing the Weighted Average Dividend Growth Rate (due to its 5 Year Dividend Growth Rate [CAGR] of 10.16%). These metrics indicate that both companies can play crucial strategic roles within the portfolio and align with its investment approach.
Investor Benefits of The Dividend Income Accelerator Portfolio After Investing $100 in BHP Group and $100 in Microsoft
Below you can see the updated composition of The Dividend Income Accelerator Portfolio after the incorporation of BHP Group and Microsoft:
Source: Interactive Brokers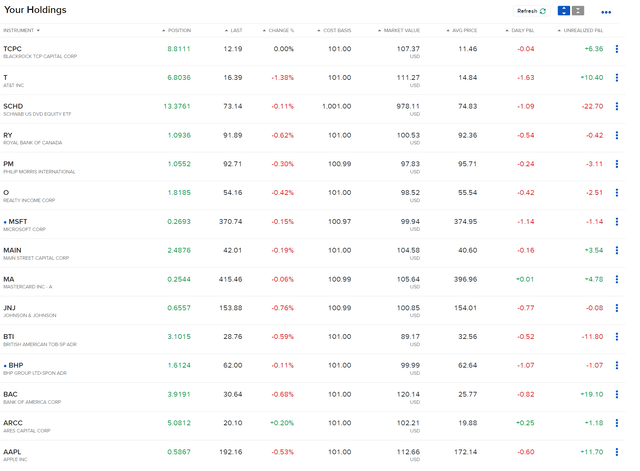
After the incorporation of BHP Group and Microsoft into The Dividend Income Accelerator Portfolio, the Weighted Average Dividend Yield [TTM] of the portfolio has been slightly decreased from 4.69% to 4.56%.
The portfolio’s 5 Year Weighted Average Dividend Growth Rate [CAGR], however, has been increased from 9.03% to 9.12%.
In addition to that, the portfolio’s diversification has been raised, due to the augmented share of the Materials Sector (through the incorporation of BHP Group) and the Information Technology Sector (through the inclusion of Microsoft) on the overall investment portfolio.
The proportion of the Information Technology Sector has increased from 10.19% to 13.37% while the Materials Sectors has gone up from 0.84% to 4.90%.
With the inclusion of BHP Group and Microsoft, the proportion of the Financials Sector has been decreased from 35.31% to 33.07%.
This shows that we have managed to slightly decrease the sector-specific concentration risk of this portfolio, providing investors with a reduced overall risk level.
Below you can see the current diversification across sectors of The Dividend Income Accelerator Portfolio after the acquisition of BHP Group and Microsoft.
The chart illustrates the portfolio’s diversification when allocating Schwab U.S. Dividend Equity ETF (NYSEARCA:SCHD) (which currently represents the largest position with a proportion of 40.17%) across the sectors it is invested in.
Source: The Author, data from Seeking Alpha and Morningstar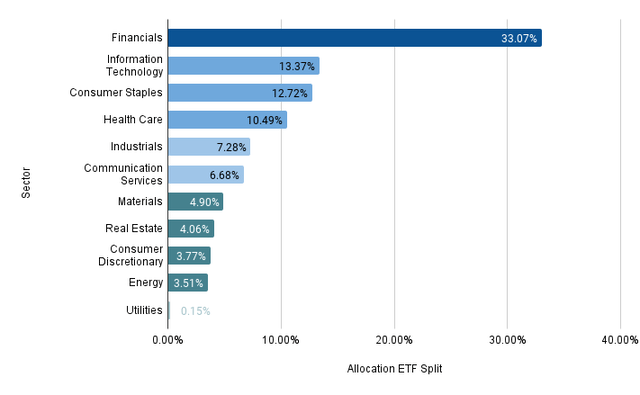
Conclusion
BHP Group and Microsoft have been important strategic acquisitions for The Dividend Income Accelerator Portfolio.
Due to their significant competitive advantages, their financial health (A1 and Aaa credit rating from Moody’s), their currently fair Valuations and combined mixture of dividend income and dividend growth, I consider both to be attractive additions for The Dividend Income Accelerator Portfolio, aligning with its investment approach.
With their incorporations, we have managed to increase the 5 Year Weighted Average Dividend Growth Rate [CAGR] of the portfolio from 9.03% to 9.12%. However, the portfolio’s Weighted Average Dividend Yield [TTM] has been slightly decreased (from 4.69% to 4.56%).
With these recent incorporations, we have further managed to slightly decrease the sector-specific concentration risk of the portfolio (which has been a result of its large exposure to the Financials Sector).
The proportion of the Financials Sector compared to the overall portfolio has been decreased from 35.31% to 33.07% (when allocating Schwab U.S. Dividend Equity ETF to the sectors it is invested in).
Within the coming weeks, I plan to incorporate additional companies into The Dividend Income Accelerator Portfolio to further increase its diversification, reduce sector-specific concentration risk, and to lower the overall risk level.
At the same time, I will stay committed to the long-term investment approach of the portfolio, and its objective to blend dividend income with dividend growth, aiming to maximize the benefits for investors who follow the investment approach of The Dividend Income Accelerator Portfolio.
Author’s Note: Thank you for reading! I would appreciate hearing your opinion on my selection of BHP Group and Microsoft as the latest acquisitions for The Dividend Income Accelerator Portfolio. Feel free to share any thoughts about The Dividend Income Accelerator Portfolio or to share any suggestion of companies that would fit into its investment approach!
Read the full article here


