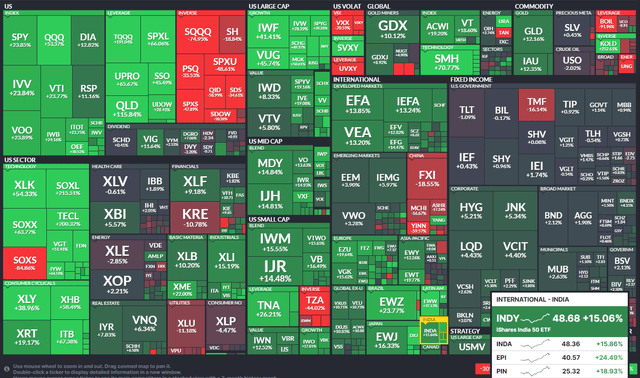
International stocks have generally underperformed in 2023. Large-cap US equities led the charge through the first seven months of the year before an August through late-October correction. The last two months have featured a snapback among domestic small and mid-caps. Meanwhile, a weakening US dollar and easing interest rates have been a boon for some ex-US markets. India’s Nifty 50 Index is among them. That group of stocks has notched all-time highs this month.
I see more upside to come for the iShares India 50 ETF (NASDAQ:INDY). I see its valuation as decent given growth potential while the technical situation is favorable.
YTD ETF Performance Heat Map: Decent Returns From India, Pacing With Ex-US Markets
Finviz
According to the issuer, INDY seeks to track the investment results of an index composed of 50 of the largest Indian equities, also known as the Nifty 50 Index, using a representative sampling technique. It offers investors exposure to the most prominent companies in India through a single fund and is used to express a country view. The ETF invests in companies across sectors and styles.
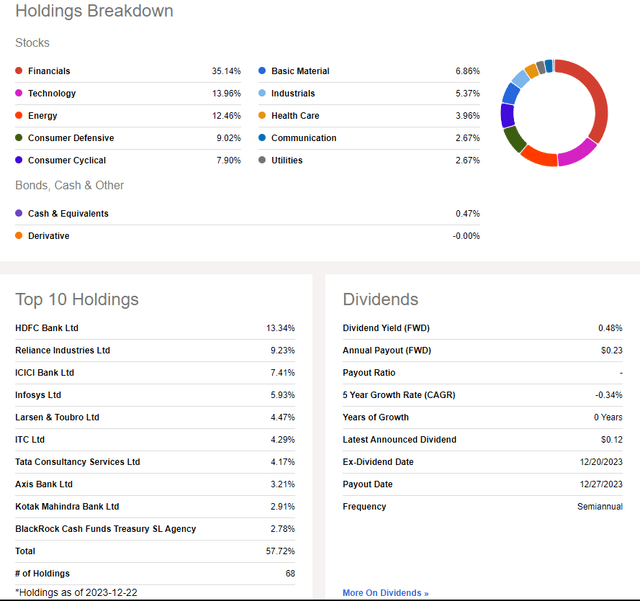
INDY is a somewhat small ETF with just $754 million in assets under management and it pays a low 0.5% forward dividend yield, as of December 22, 2023. Share-price momentum is very strong right now with the ETF not far from its 52-week high. Still, it’s a rather expensive fund considering an annual expense ratio of 0.89% – some of its peers have expense ratios significantly below that rate. From a risk point of view, the fund’s high tracking error over several timeframes can create issues, though its 13.7% standard deviation is not all that high. Finally, with average daily trading volume of more than 70k shares and a 30-day median bid/ask spread of 13 basis points, investors should use caution when trading – I encourage investors to use limit orders to prevent bad fills given the high bid/ask spread and liquidity profile.
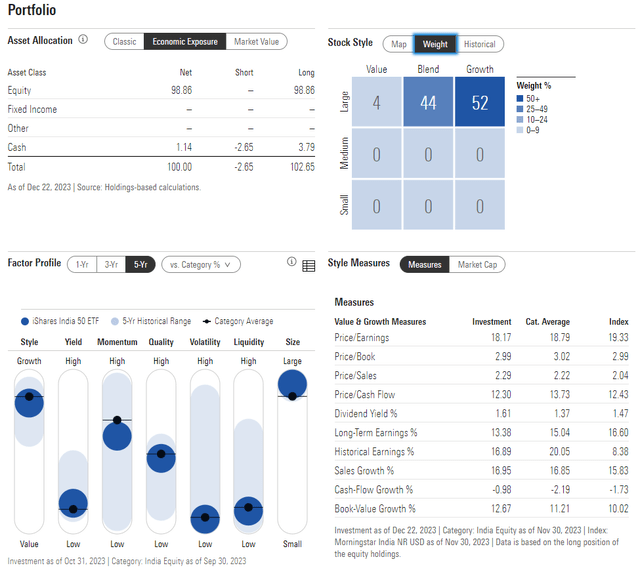
Digging into the portfolio, the two-star, gold-rated ETF (by Morningstar) has high exposure to the large-cap growth corner of the style box. Thus, trends in expected GDP rates and firm-specific growth outlooks are important to monitor. Often, when macroeconomic growth is weak, growth stocks can actually fare well since high-growth equities are seen as scarce and valuable. There is just 4% exposure to the value style and no small or mid-cap exposure. With a price-to-earnings ratio near 18 and a long-term earnings growth rate above 13, the PEG is quite reasonable, so I see it as a buy on valuation.
INDY: Portfolio & Factor Profiles
Morningstar
Where there’s risk, though, is with INDY’s sector allocation. Financials comprise more than one-third of the fund while the Information Technology sector is the second-largest weight at just under 14%. Energy is a significant overweight compared to the S&P 500. There is no Real Estate exposure, but there’s decent diversification among the remaining sectors. The top three positions account for about 30% of the fund, so single-stock risk is also to the high side.
INDY: Holdings & Dividend Information
Seeking Alpha
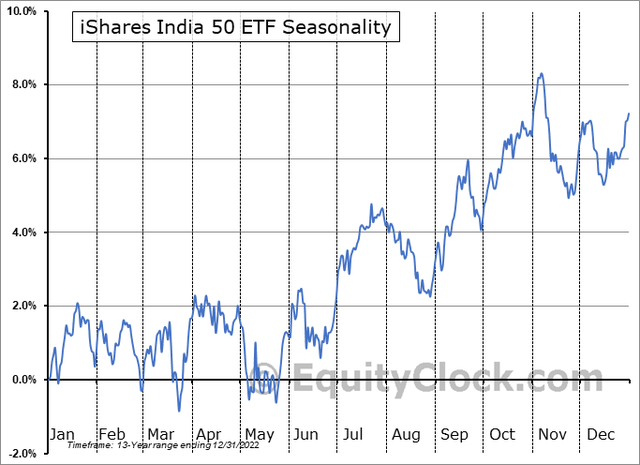
Seasonally, INDY tends to trade sideways through the first handful of months of the year following strong second-half returns, according to data from Equity Clock. If that trend plays out again in 2024, then being tactical with entries and exits will be key over the next several months.
INDY: Neutral Risks Through Q1
Equity Clock
The Technical Take
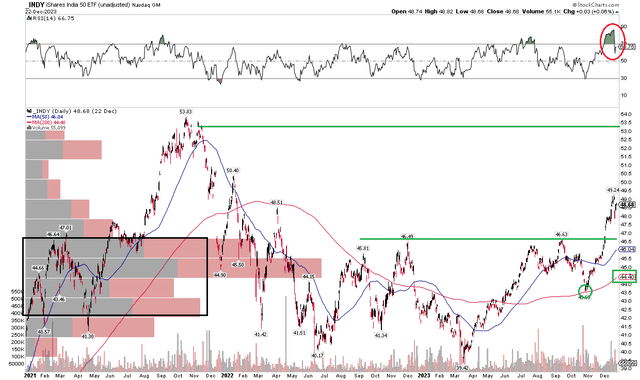
With a decent valuation and mixed risk characteristics, the technical situation appears favorable. Notice in the chart below that shares have risen through a key resistance point and may soon test the 2021 high just shy of $54. The bulls took INDY above the $46 to $47 area on a rally earlier this month, including a gap-up. Considering a low of $39.42 was notched back in March, then we can project a measured move target on top of that – that $7.20 range added to the $46.60 breakout point gives us a target to $53.80 – near the exact Q4 2021 peak.
Also take a look at the rising 200-day moving average – INDY held that line on a test in late October. The fact that the 200dma is positively sloped is a favorable sign, too. What’s more, with a high amount of volume by price from about $40 to $46, there should be ample support on pullbacks. Finally, I am encouraged to see that the ETF is holding up just fine despite being in technical ‘overbought’ territory, as evidenced by the RSI momentum indicator at the top of the graph.
Overall, the chart and trend appear constructive, and I would look for an eventual rally to the low to mid-$50s based on the technical features.
INDY: Bullish Breakout, Eyeing $54, Rising 200dma
StockCharts.com
The Bottom Line
I have a buy rating on INDY. I see the valuation as reasonable today while the chart looks bullish following an impressive bounce off its October low.
Read the full article here


