Don’t jump to conclusions based on one month’s number.
The Final Demand version of the Producer Price Index rose 0.6% in February, and that was twice the amount the market expected to see.
A Bloomberg headline on Thursday morning said, “Bond Yields Jump as Hot Inflation Curbs Fed Wagers.” Worse still, the full version of the PPI rose 1.4% in February. OMG!
Well, the reality is very different, as these two charts show.
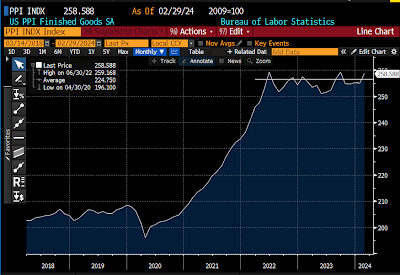
Chart #1

Chart #1 shows the level of the Producer Price Index. As the line in the upper right-hand corner suggests, prices have been unchanged since June ’22.
Monthly datapoints jump up and down quite a bit, but on balance, prices are going nowhere. In fact, the PPI is down 0.2% since June ’22.
Want more? Prices for unprocessed goods for intermediate demand (another subset of the PPI) have plunged by 31% since June ’22.
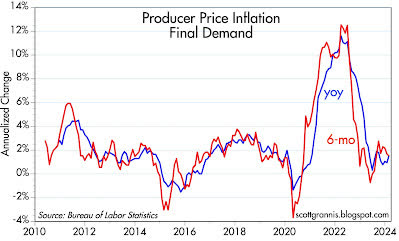
Chart #2

Chart #2 shows the 6-mo. annualized and year-over-year change in the Final Demand version of the PPI – the one that has given the market the willies on Thursday morning.
What do we see? The year-over-year change in this measure of inflation is 1.55%, and it has been less than 2% since April ’23.
Inflation at the producer level has not been a concern for many months. It’s effectively dead.
If the Fed gurus have any sense at all, they will realize that there was nothing in Thursday’s news that would argue against a cut in the short term.
Original Post
Editor’s Note: The summary bullets for this article were chosen by Seeking Alpha editors.
Read the full article here


