Dividend investing will never go out of fashion, with the reason for that being an enormous cohort of investors who prefer cold, hard cash over capital gains that are fickle in nature. A severe blow to the market might erase them rapidly, with the risk that they will never be restored, but stable, durable, and predictable dividends are immune to it. Sometimes, they are even immune to recessions or a few of them. However, it goes without saying that not all dividend strategies are created equal. Some are much more selective, chasing the most resilient and promising stories. One of the examples is the FlexShares Quality Dividend Index Fund ETF (NYSEARCA:QDF), an investment vehicle I am providing an update on today. QDF pursues top-quality U.S. dividend stories, focusing on management efficiency, profitability, and cash flows. Does its approach stand out? Though it has a few advantages, alas, this is an underperforming strategy that delivered an unsatisfying downside capture ratio in the past, unable to beat either the iShares Core S&P 500 ETF (IVV) or the iShares Russell 1000 ETF (IWB). Unfortunately, its modest dividend yield did not compensate for soft price performance.
Today, I would like to take a look at the recalibrated version of its portfolio (there have been two reconstitutions since the previous note, namely in November and February, with the next one due this May) to identify factor exposure changes worth discussing. This is also necessary to explain why I remain rather lukewarm about this vehicle. Besides, I believe it is worth covering contributors to and detractors from QDF’s performance at some length.
What are the principles of QDF’s strategy?
To recap, QDF was incepted in December 2012 and is based on the Northern Trust Quality Dividend Index. As we know from the summary prospectus, its essential idea is to select the group of the worthiest dividend-paying companies from the Northern Trust 1250 Index. To achieve the desired composition, constituents “that rank in the lowest quintile of quality based on a proprietary scoring model” are removed immediately. Obviously, firms with no dividends are also ignored. As to the structure of the model, it comprises management efficiency, profitability, and cash flow generation. Next comes the optimization process, which is integral to the index calibration. It is designed to meet three major goals: 1) bolster the quality score; 2) boost the dividend yield; and 3) “achieve the desired beta target.” Page 2 of the summary prospectus says that the process includes other considerations, namely
…sector, industry group, single-security weight and turnover constraints to assist in reducing the Underlying Index’s overall active risk exposure to any one single factor.
Why has QDF underperformed the S&P 500 index since the previous note?
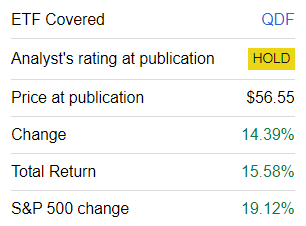
I would not say QDF’s performance since the previous note was overwhelmingly upsetting, as it has delivered mostly strong gains, yet the fly in the ointment is that its dividend and quality-oriented strategy has still been unable to keep pace with the growth-heavy S&P 500, which has been better positioned to benefit from the inflation-is-over narrative.
Seeking Alpha
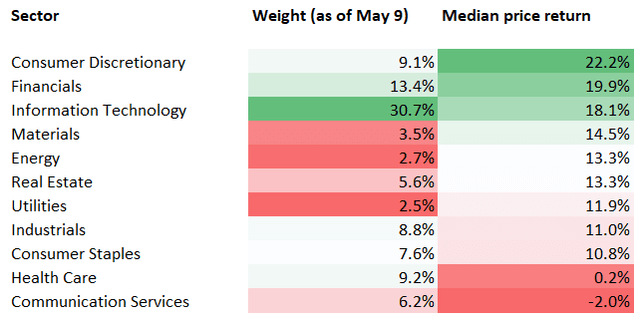
Delving deeper, I should note that among the main detractors from QDF’s performance over the period were the communication services and health care sectors, which is evident from the median sector returns I prepared using the share prices as of November 7 and May 10.
Calculated using data from Seeking Alpha and the ETF
Looking at the individual contributors, we see that Williams-Sonoma (WSM) was the key one, as its stock price has more than doubled over the period. NVIDIA (NVDA) and Eagle Materials (EXP) were in the second and third places, respectively.
| Symbol | Weight (May 9) | Sector | % price return |
| WSM | 0.7% | Consumer Discretionary | 110% |
| NVDA | 3.9% | Information Technology | 95.2% |
| EXP | 0.1% | Materials | 63.6% |
Calculated using data from Seeking Alpha and QDF
Here, I should quickly remark that the fund’s obsession with trillion-dollar bellwethers (as they account for about a fifth of the net assets, with Apple (AAPL) alone having an 8.2% weight) is certainly a good thing from a capital gains standpoint (at least, it has been of late), but from a dividend standpoint, it is more of a detractor. For example, with a forward Price/Sales ratio of 19.7x, NVDA is currently yielding just 2 bps. I perfectly understand why this AI bellwether is valued so generously: it is the AI great expectations premium that makes it so expensive. But I suppose most of my dear readers would agree that this is hardly a stock to chase for a dividend investor.
Speaking of detractors that hindered QDF from outperforming the S&P 500, the trio of stocks that dipped most are Gilead Sciences (GILD), Iridium Communications (IRDM), and Starbucks (SBUX).
| Symbol | Weight (May 9) | Sector | % price decline |
| SBUX | 0.6% | Consumer Discretionary | -26.6% |
| IRDM | 0.4% | Communication Services | -20.8% |
| GILD | 0.8% | Health Care | -18.1% |
Calculated using data from Seeking Alpha and QDF
How has the index reconstitutions impacted QDF’s factor balance?
Since November 2023, about 11% of the QDF portfolio has been replaced. For example, Amgen (AMGN), Abbott Laboratories (ABT), and BlackRock (BLK) were ousted, while Toll Brothers (TOL), PulteGroup (PHM), and 3M (MMM) were added. In total, the ETF has seen 15 additions, with their combined weight being around 8.4% as of May 9.
I believe that among these newcomers, Solventum Corporation (SOLV) should be mentioned despite its microscopic weight of 10 bps. The reason here is that SOLV does not pay a dividend, which is confusing, assuming QDF’s strategy. Moreover, as we know from page 57 of its Form 10-Q,
Solventum does not currently anticipate paying a regular dividend on its common stock in the near future.
Delving deeper, we see that SOLV was spun off from 3M in March and was likely added to QDF’s portfolio as a consequence. Hence, as a company with no DPS, it will likely be removed during the quarterly reconstitution this May.
After this brief digression, let’s answer a few questions. First, how have capital appreciation and portfolio composition changes impacted QDF’s factor story? And second, why am I still unimpressed? The following metrics should answer these questions:
| Metric | 8 May 2023 | 6 November 2023 | 9 May 2024 |
| Market Cap | $526.76 billion | $556.57 billion | $644.57 billion |
| P/S | 5.2 | 5.6 | 6.8 |
| EY | 6.8% | 4.9% | 4.5% |
| Fwd EPS | 5.4% | 5.99% | 8.7% |
| Fwd Revenue | 4.5% | 5.2% | 6.3% |
| ROE | 48.5% | 80.6% | 60% |
| ROA | 13.1% | 12.1% | 13% |
| Quant Valuation B- or higher | 14.5% | 13.1% | 13.9% |
| Quant Valuation D+ or weaker | 62.4% | 64.9% | 67.7% |
| Quant Profitability B- or higher | 96.1% | 92.8% | 91.5% |
| Quant Profitability D+ or weaker | None | 2.5% | 2.5% |
| 24M beta | 0.95 | 0.99 | 1.02 |
| 60M beta | 1.05 | 1.04 | 1.05 |
Calculated by the author using data from Seeking Alpha and the ETF
- First, regarding value exposure, we see that QDF’s weighted-average market cap is now at the highest level since I started covering it a year ago. The major reason here is its exposure to trillion-dollar companies and especially to NVDA, which has almost doubled over the period, thus also impacting the ETF’s earnings yield and P/S ratio. At the same time, QDF’s allocation to companies with a B- Quant Valuation grade or higher has increased just marginally, remaining below the May 2023 level. That is to say, QDF is not a value play, and I have serious doubts that it might become attractively valued going forward.
- In the meantime, interesting developments can be observed on the growth front. An increase in the forward revenue growth rate to 6.3% is somewhat confusing, assuming the share of companies that are forecast to tackle sales contraction has risen from around 20% to 25%. Upon deeper inspection, it seems NVDA is responsible for the improvement, as its forward sales growth rate jumped from 43.4% to 72.4%. For clarity, with NVDA’s growth rate cut to 43.4% for modeling purposes, the weighted-average figure would drop to the exact same level we saw in November. Without NVDA, the growth rate would be 3.5%.
- Quality remains the strongest component of QDF’s factor mix. Little can be criticized here, as just five holdings out of 130 have a D+ Quant Profitability rating or lower. As to Return on Equity, adjusted for the impact of companies with overinflated figures heavily influenced by debt, the ROE is at 24.8%, which is both robust and realistic.
| Stock | Weight | Sector | ROE | Debt/Equity |
| Home Depot (HD) | 1.7% | Consumer Discretionary | 1162.16% | 5086.30% |
| Colgate-Palmolive (CL) | 0.2% | Consumer Staples | 531.67% | 1408.27% |
| Mastercard (MA) | 0.3% | Financials | 186.32% | 213.86% |
| AAPL | 8.2% | Information Technology | 147.25% | 140.97% |
| Western Union (WU) | 0.5% | Financials | 129.78% | 638.43% |
| Warner Music Group (WMG) | 0.4% | Communication Services | 113.14% | 697.40% |
| Illinois Tool Works (ITW) | 0.8% | Industrials | 100.03% | 275.57% |
Data from Seeking Alpha and the ETF
Dividend credentials are also certainly worth addressing.
| Metric | November 2023 | May 2024 |
| Yield TTM | 2.6% | 2.3% |
| Div Growth 3Y | 11.3% | 11% |
| Div Growth 5Y | 10.6% | 9.5% |
Calculated by the author using data from Seeking Alpha and the ETF
Here, we see only marginal differences, with the weighted-average dividend yield down predominantly because of the equity mix becoming more expensive overall.
Would I recommend QDF to investors today?
In sum, the FlexShares Quality Dividend Index Fund ETF pursues quality dividend stories, putting more emphasis on mega-cap bellwethers. This vehicle clearly delivers quality characteristics worth appreciating, with the growth profile now being the strongest since I started covering it last year. Would I recommend it then? I would not.
The chief problem I see here is that, despite sounding alluring, this approach does not deliver anything remarkable, both yield-wise and performance-wise. Its downside capture ratio, something that I did not mention in the previous note, is the key disappointment here. Let me corroborate by comparing its total returns and other performance metrics to the results delivered by IVV and IWB.
| Portfolio | QDF | IVV | IWB |
| Initial Balance | $10,000 | $10,000 | $10,000 |
| Final Balance | $34,019 | $43,515 | $42,252 |
| CAGR | 11.41% | 13.85% | 13.56% |
| Stdev | 14.84% | 14.68% | 14.87% |
| Best Year | 36.29% | 32.30% | 32.78% |
| Worst Year | -12.12% | -18.16% | -19.19% |
| Max. Drawdown | -25.21% | -23.93% | -24.57% |
| Sharpe Ratio | 0.72 | 0.87 | 0.85 |
| Sortino Ratio | 1.1 | 1.38 | 1.33 |
| Market Correlation | 0.97 | 1 | 1 |
| Upside Capture | 92.61% | 100.35% | 99.72% |
| Downside Capture | 99.10% | 97.13% | 97.82% |
Data from Portfolio Visualizer. The period is January 2013–April 2024
So, regardless of the possible market trajectory, I see no justification for a rating upgrade. Overall, even though QDF is not a clear Sell, as I frequently say in my notes, it simply does not stand out.
Read the full article here
