
REIT Performance
The REIT sector saw a 4th straight month of gains in August with a +2.11% average total return. REITs fell short of the S&P 500 (+2.4%) in August, but outpaced the Dow Jones Industrial Average (+2.0%) and NASDAQ (+0.7%). The market cap weighted Vanguard Real Estate ETF (VNQ) significantly outperformed the average REIT in August (+5.22% vs. +2.11%) and has also outperformed year-to-date (+9.93% vs. +6.97%). The spread between the 2024 FFO multiples of large cap REITs (19.6x) and small cap REITs (13.9x) widened in August as multiples expanded 2.1 turns for large caps but only 0.2 turns for small caps. Investors currently need to pay an average of 41.0% more for each dollar of FFO from large cap REITs relative to small cap REITs. In this monthly publication, I will provide REIT data on numerous metrics to help readers identify which property types and individual securities currently offer the best opportunities to achieve their investment goals.
Source: Graph by Simon Bowler of 2nd Market Capital, Data compiled from S&P Global Market Intelligence LLC. See important notes and disclosures at the end of this article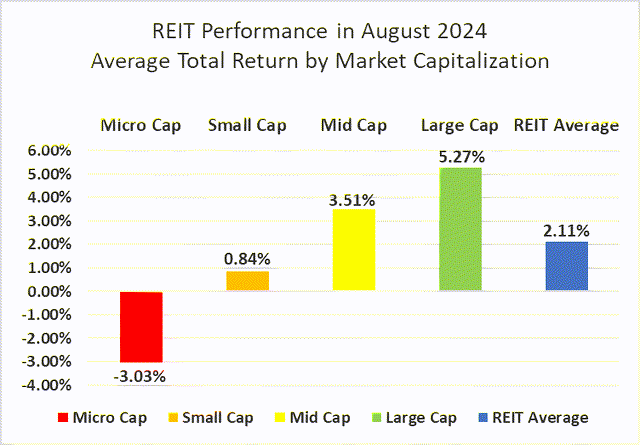
Large caps (+5.27%) led the REIT sector, followed by smaller gains from mid-caps (+3.51%) and small caps (+0.84%). Micro cap REITs (-3.03%) struggled in August. Large cap REITs have outperformed small caps by 593 basis points through the first eight months of 2024.
Source: Graph by Simon Bowler of 2nd Market Capital, Data compiled from S&P Global Market Intelligence LLC. See important notes and disclosures at the end of this article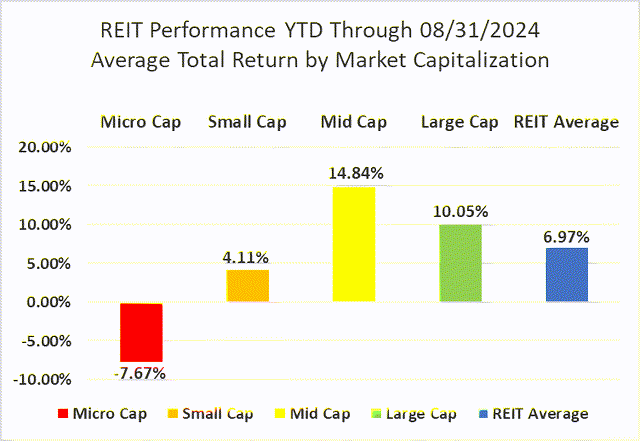
13 out of 18 Property Types Yielded Positive Total Returns in August
72.22% of REIT property types averaged a positive total return in August. There was a narrow 11.51% total return spread between the best and worst performing property types. Self-Storage (+9.34%) was the top-performing property type in August, fueled by a strong +15.48% return from Public Storage (PSA).
Shopping Centers (-2.18%) were the worst performing property type in August due to the collapse in share price of Wheeler REIT (WHLR) (-75.88%).
Source: Table by Simon Bowler of 2nd Market Capital, Data compiled from S&P Global Market Intelligence LLC. See important notes and disclosures at the end of this article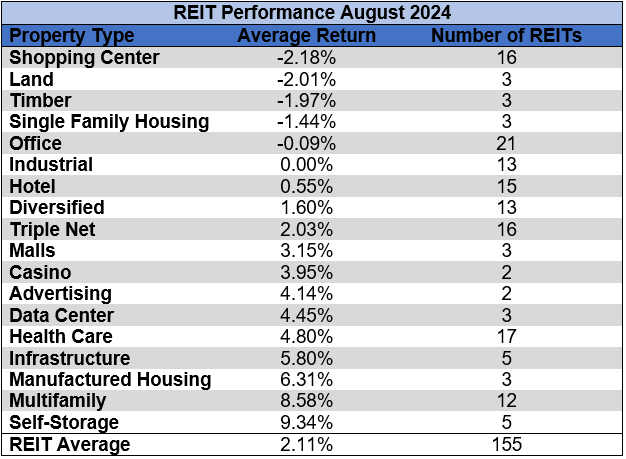
Timber (-9.33%) and Hotels (-6.46%) remain the worst performing REIT property types year-to-date. Data Centers (+26.25%) and Advertising (+23.17%) continue to lead the REIT sector with the strongest average total returns over the first 8 months of 2024.
Source: Table by Simon Bowler of 2nd Market Capital, Data compiled from S&P Global Market Intelligence LLC. See important notes and disclosures at the end of this article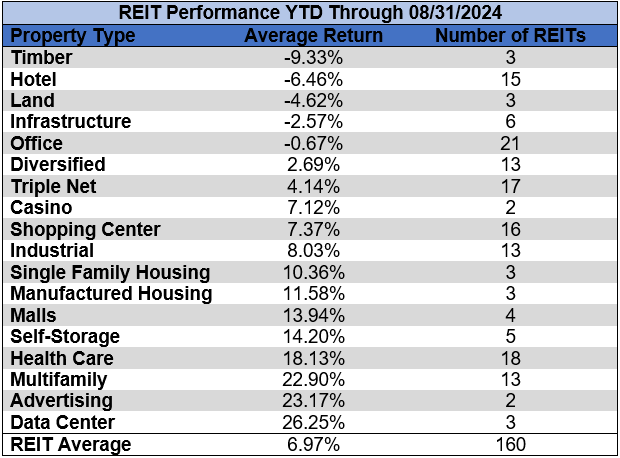
The REIT sector as a whole saw the average P/FFO (2024Y) increase 0.8 turns in August from 14.2x up to 15.0x. 83.3% of property types averaged multiple expansion and 16.7% saw multiple contraction. Data Centers (30x), Land (27.1x), Multifamily (22.8x), Manufactured Housing (21.4x) and Single Family Housing (20.7x) currently trade at the highest average multiples among REIT property types. Hotels (8.0x), Malls (8.6x) and Office (8.8x) are the only property types that average single digit FFO multiples.
Source: Table by Simon Bowler of 2nd Market Capital, Data compiled from S&P Global Market Intelligence LLC. See important notes and disclosures at the end of this article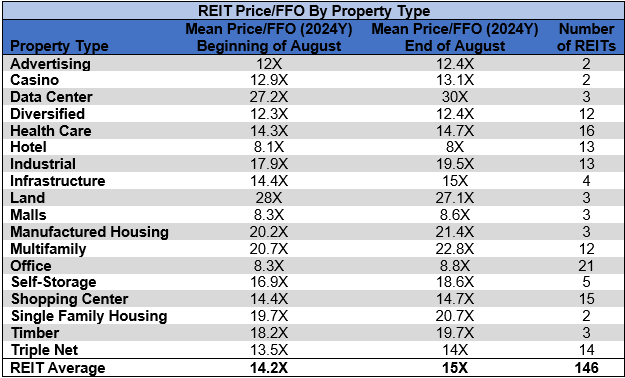
Performance of Individual Securities
American Healthcare REIT (AHR) (+29.36%) led all REITs in August and is now the 3rd best performer thus far in 2024 with a stellar +61.43% year-to-date return. AHR trails only Power REIT (PW) (+106.25%) and Iron Mountain (IRM) (+62.55%) YTD. AHR posted a strong earnings beat on August 5th, which fueled a rally throughout the rest of the month.
Wheeler REIT (WHLR) (-75.88%) continued to crash in August after similarly plummeting in July (-68.77%). Wheeler fell a disastrous -96.80% in just the first 8 months of the year.
68.39% of REITs had a positive total return in August. During the first eight months of 2023, the average REIT had only a +0.56% return. The REIT sector began the first eight months of 2024, however, with a much stronger +6.97% average total return.
Source: Table by Simon Bowler of 2nd Market Capital, Data compiled from S&P Global Market Intelligence LLC. See important notes and disclosures at the end of this article Source: Table by Simon Bowler of 2nd Market Capital, Data compiled from S&P Global Market Intelligence LLC. See important notes and disclosures at the end of this article Source: Table by Simon Bowler of 2nd Market Capital, Data compiled from S&P Global Market Intelligence LLC. See important notes and disclosures at the end of this article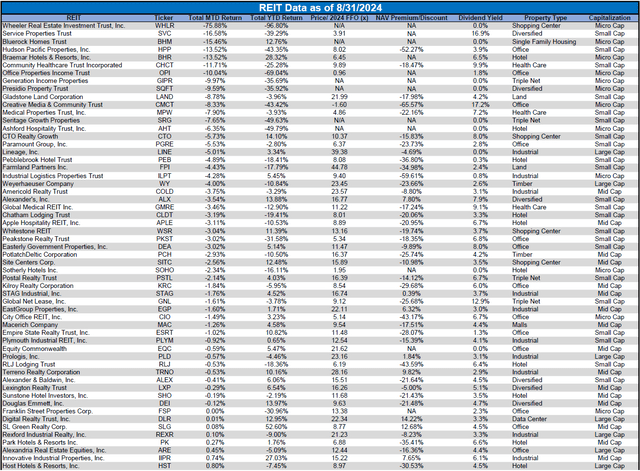
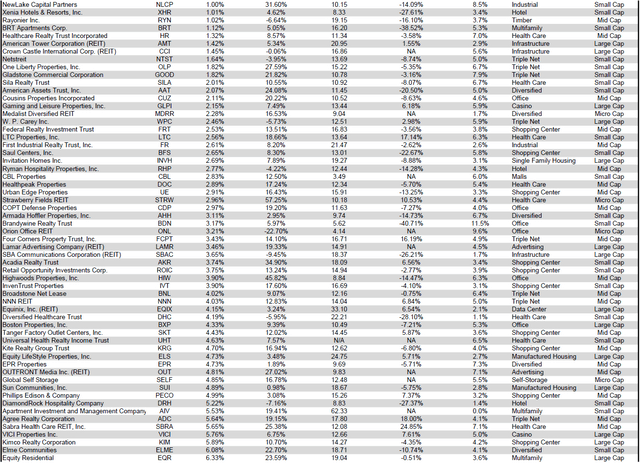
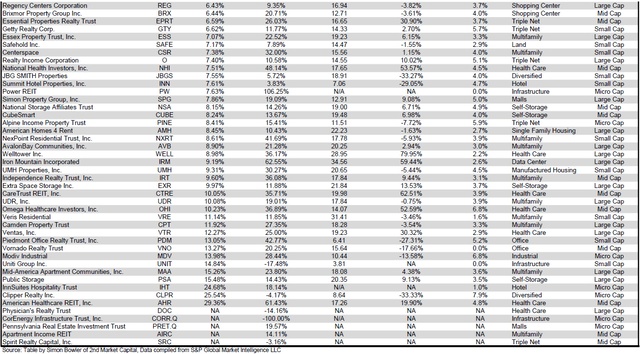
For the convenience of reading this table in a larger font, the table above is available as a PDF as well.
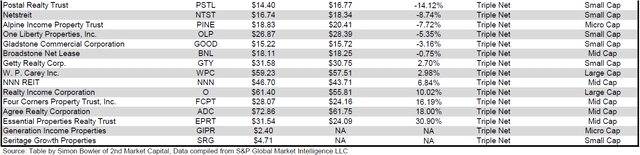
Dividend Yield
Dividend yield is an important component of a REIT’s total return. The particularly high dividend yields of the REIT sector are, for many investors, the primary reason for investment in this sector. As many REITs are currently trading at share prices well below their NAV, yields are currently quite high for many REITs within the sector. Although a particularly high yield for a REIT may sometimes reflect a disproportionately high risk, there exist opportunities in some cases to capitalize on dividend yields that are sufficiently attractive to justify the underlying risks of the investment. I have included below a table ranking equity REITs from highest dividend yield (as of 08/31/2024) to lowest dividend yield.
Source: Table by Simon Bowler of 2nd Market Capital, Data compiled from S&P Global Market Intelligence LLC. See important notes and disclosures at the end of this article Source: Table by Simon Bowler of 2nd Market Capital, Data compiled from S&P Global Market Intelligence LLC. See important notes and disclosures at the end of this article Source: Table by Simon Bowler of 2nd Market Capital, Data compiled from S&P Global Market Intelligence LLC. See important notes and disclosures at the end of this article Source: Table by Simon Bowler of 2nd Market Capital, Data compiled from S&P Global Market Intelligence LLC. See important notes and disclosures at the end of this article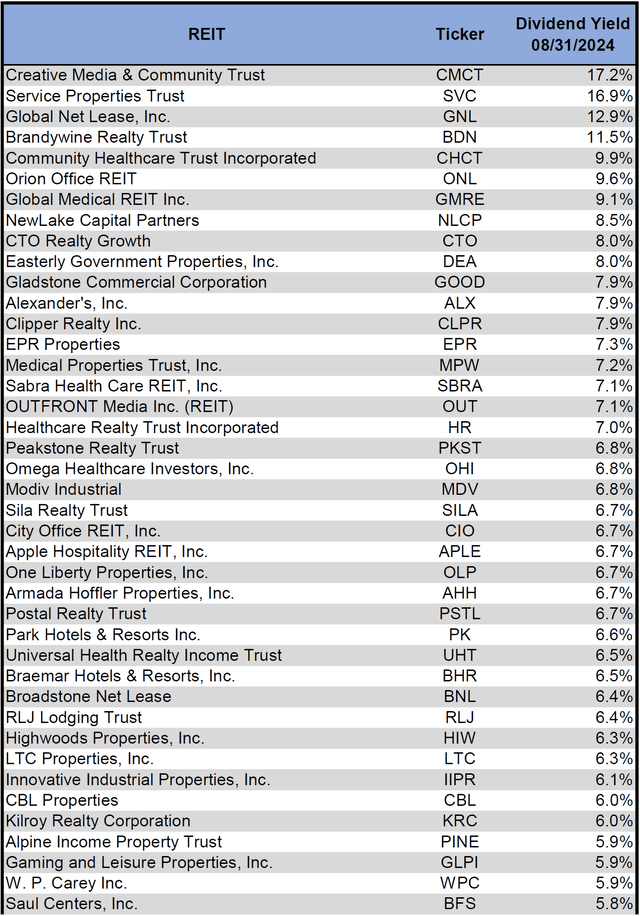
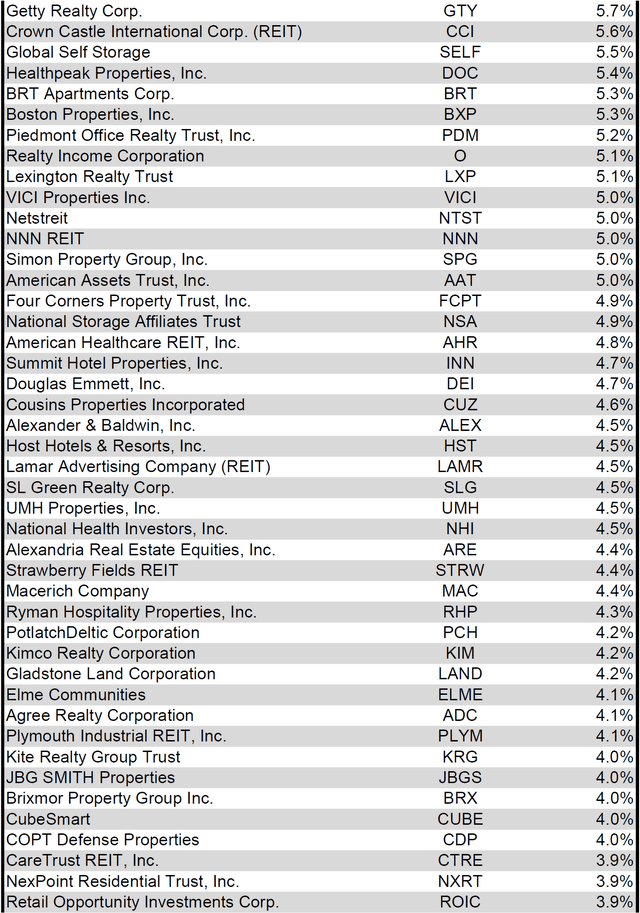
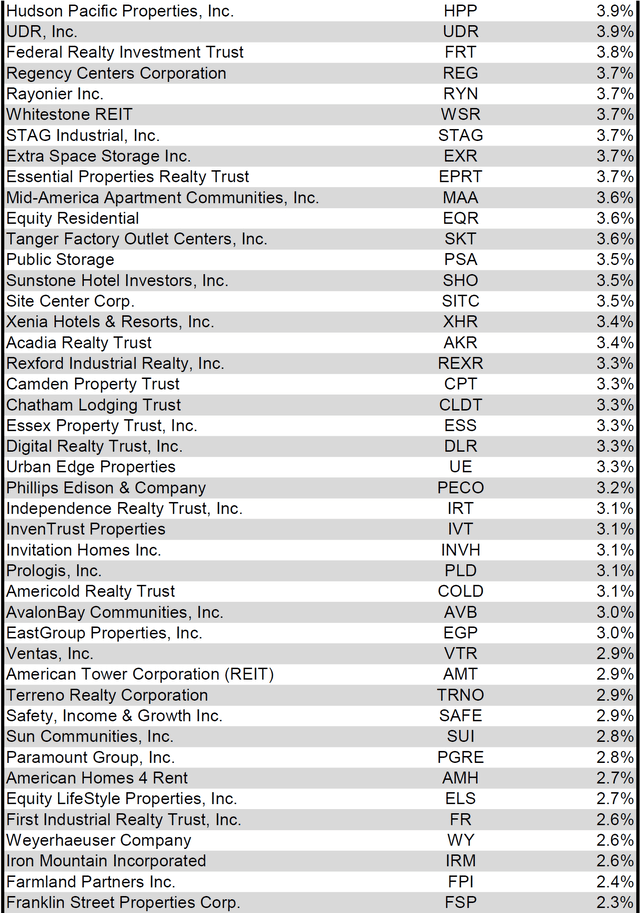
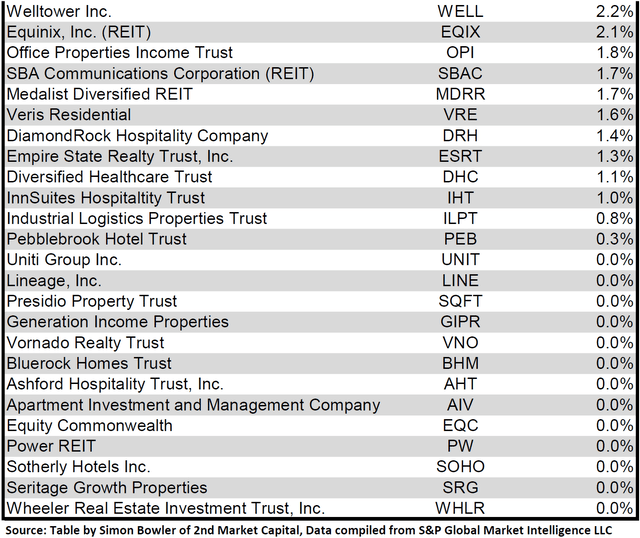
For the convenience of reading this table in a larger font, the table above is available as a PDF as well.
Although a REIT’s decision regarding whether to pay a quarterly dividend or a monthly dividend does not reflect the quality of the company’s fundamentals or operations, a monthly dividend allows for a smoother cash flow to the investor. Below is a list of equity REITs that pay monthly dividends ranked from highest yield to lowest yield.
Source: Table by Simon Bowler of 2nd Market Capital, Data compiled from S&P Global Market Intelligence LLC. See important notes and disclosures at the end of this article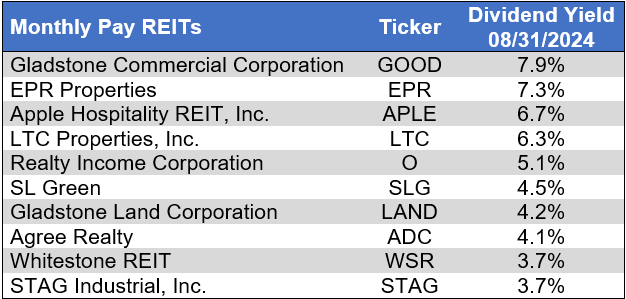
Valuation
REIT Premium/Discount to NAV by Property Type
Below is a downloadable data table, which ranks REITs within each property type from the largest discount to the largest premium to NAV. The consensus NAV used for this table is the average of analyst NAV estimates for each REIT. Both the NAV and the share price will change over time, so I will continue to include this table in upcoming issues of The State of REITs with updated consensus NAV estimates for each REIT for which such an estimate is available.
Source: Table by Simon Bowler of 2nd Market Capital, Data compiled from S&P Global Market Intelligence LLC. See important notes and disclosures at the end of this article Source: Table by Simon Bowler of 2nd Market Capital, Data compiled from S&P Global Market Intelligence LLC. See important notes and disclosures at the end of this article Source: Table by Simon Bowler of 2nd Market Capital, Data compiled from S&P Global Market Intelligence LLC. See important notes and disclosures at the end of this article Source: Table by Simon Bowler of 2nd Market Capital, Data compiled from S&P Global Market Intelligence LLC. See important notes and disclosures at the end of this article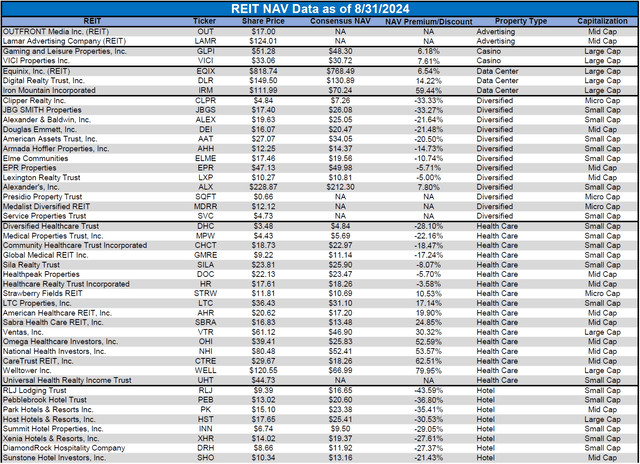
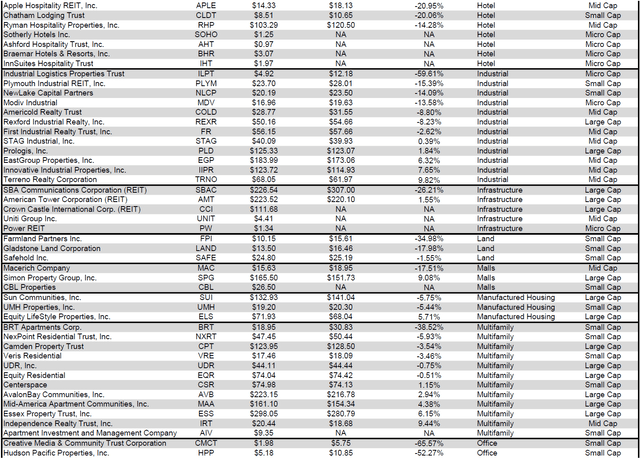
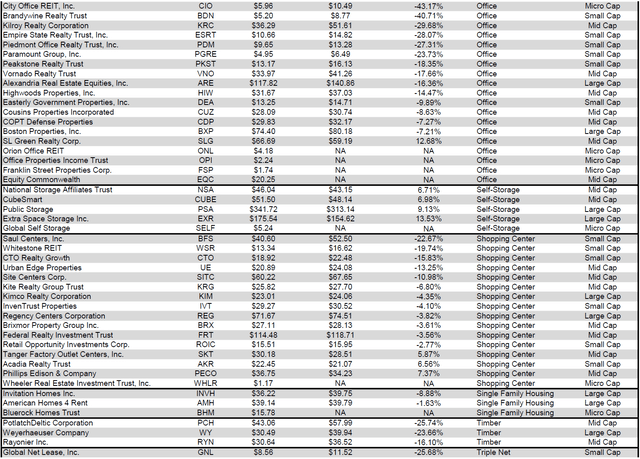
For the convenience of reading this table in a larger font, the table above is available as a PDF as well.
Takeaway
The large cap REIT premium (relative to small cap REITs) widened in August and investors are now paying on average about 41% more for each dollar of 2024 FFO/share to buy large cap REITs than small cap REITs (19.6x/13.9x – 1 = 41.0%). As can be seen in the table below, there is presently a strong positive correlation between market cap and FFO multiple.
Source: Table by Simon Bowler of 2nd Market Capital, Data compiled from S&P Global Market Intelligence LLC. See important notes and disclosures at the end of this article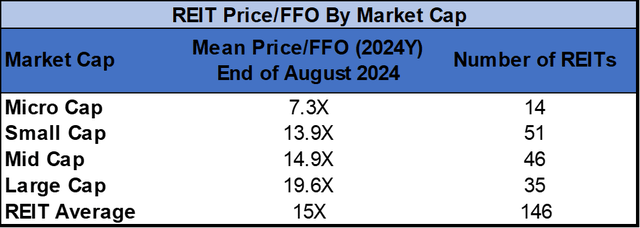
The table below shows the average NAV premium/discount of REITs of each market cap bucket. This data, much like the data for price/FFO, shows a strong, positive correlation between market cap and Price/NAV. The average large cap REIT (+3.80%) and mid cap REIT (+0.85%) trade slightly above NAV. Small cap REITs (-17.10%) trade at just over 4/5 of NAV and micro caps (-30.35%) on average trade at about 2/3 of their respective NAVs.
Source: Table by Simon Bowler of 2nd Market Capital, Data compiled from S&P Global Market Intelligence LLC. See important notes and disclosures at the end of this article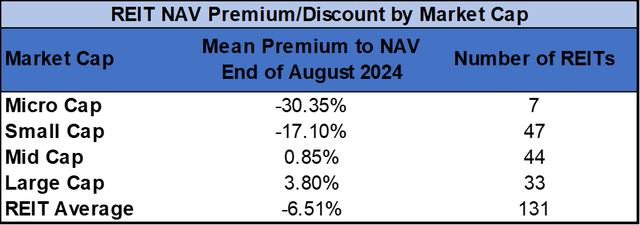
Bankruptcy filings accelerated in August and were 16.7% higher than in August 2023. The number of bankruptcies in the first eight months of 2024 outpaced the same periods of 2021, 2022 or 2023.
Source: S&P Global Market Intelligence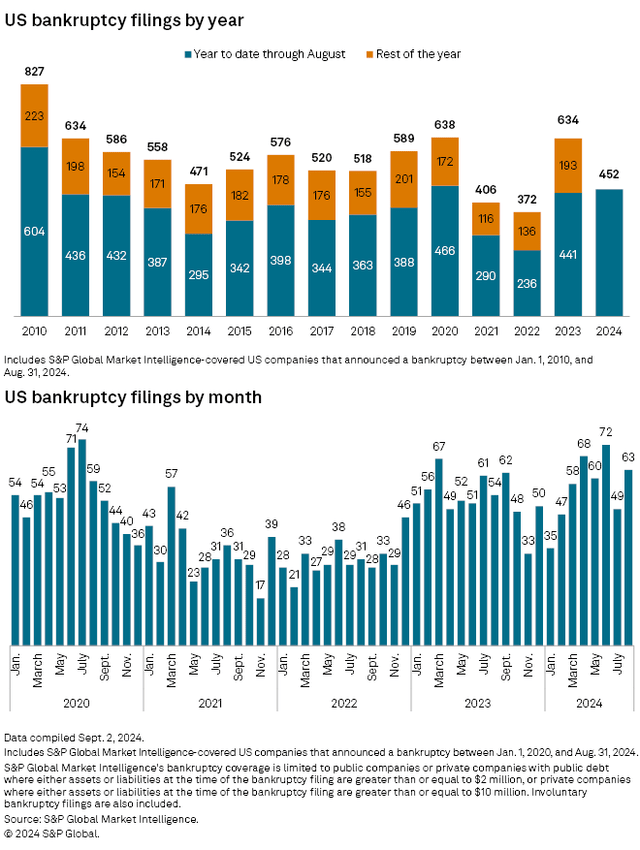
S&P Global found that of the 116 equity REITs analyzed (see image below for inclusion criteria), 67% beat Q2 FFO/share estimates, 19% had FFO in line with estimates and 14% missed. Data Centers (100%) and Diversified REITs (88.9%) were the property types in which the highest portions of REITs outperformed consensus FFO/share estimates.
Source: S&P Global Market Intelligence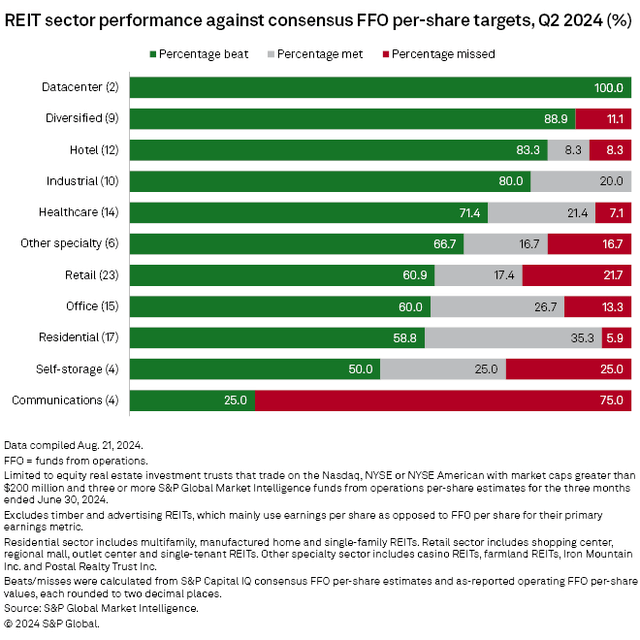
Infrastructure (Communications) was the only REIT property type in which a majority of REITs missed Q2 2024 FFO/share targets. The largest FFO/share misses were from Farmland Partners (FPI) (-50%), SBA Communications (SBAC) (-26.3%) and Community Healthcare Trust (CHCT) (-21.8%).
Source: S&P Global Market Intelligence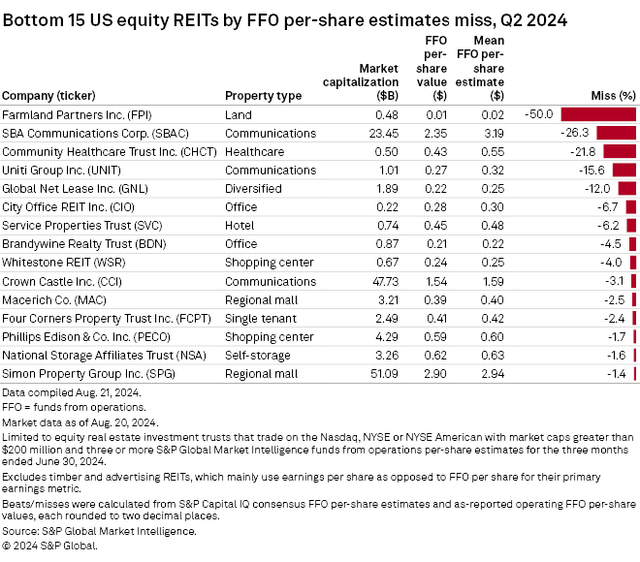
The strongest FFO/share beats were from Diversified Healthcare Trust (DHC) (+50%), Veris Residential (VRE) (+28.6%) and SL Green Realty (SLG) (+24.2%). Despite FFO misses from the other Communications REITs, American Tower (AMT) (+12.0%) handily outpaced expectations in Q2.
Source: S&P Global Market Intelligence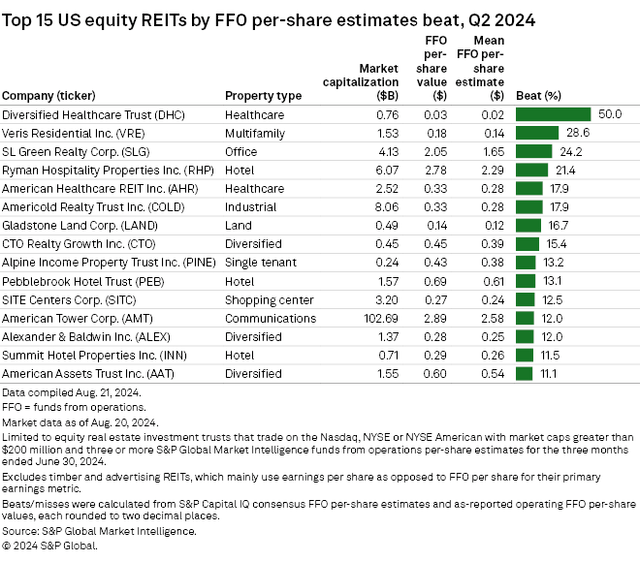
9 REITs announced quarterly dividend hikes in August. The biggest August dividend increases were by RLJ Lodging Trust (RLJ) (+50%) and Veris Residential (VRE) (+16.7%), both of which have dividends that still remain far smaller than that which they distributed pre-covid in Q4 2019 (-54.5% and -65.0% respectively). In total, 59 REITs announced dividend hikes during the first eight months of 2024.
Source: S&P Global Market Intelligence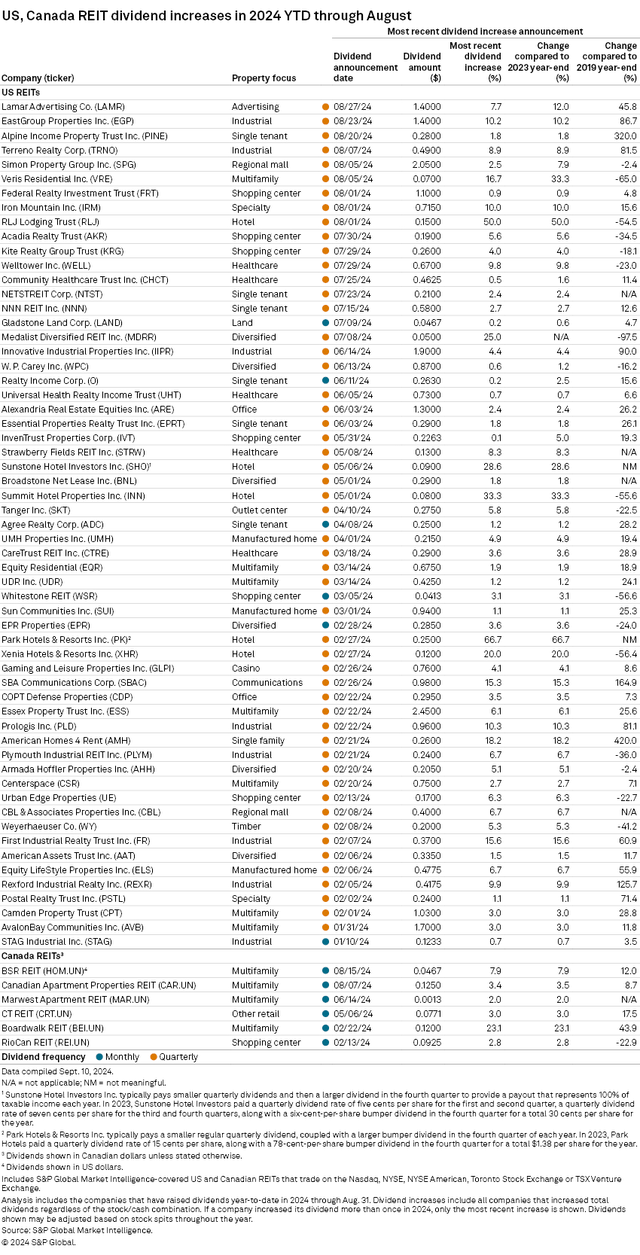
REITs Significantly Ramped Up Share Buyback Activity in Q2
Trading at a material discount to NAV presents REITs with an opportunity to repurchase shares at discounted pricing. Buying back shares for prices well-below NAV can be immediately accretive to NAV and sometimes presents an opportunity for REITs to achieve a higher return through buybacks than could be achieved through alternative uses of that capital such as acquisitions or development.
Source: S&P Global Market Intelligence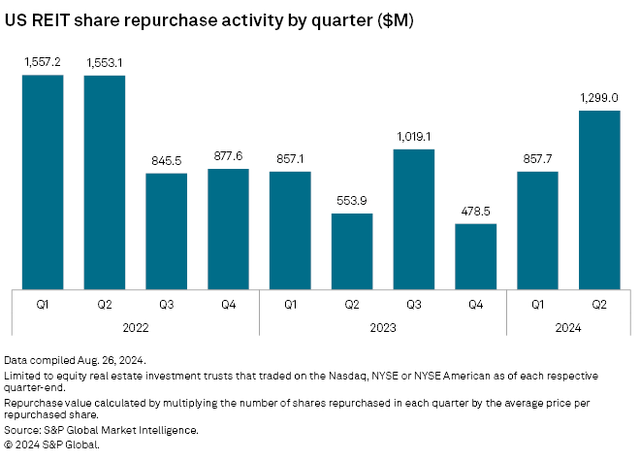
REITs ramped up share buyback volume in Q2 2024 to the highest level since Q2 2022. The most aggressive share repurchasing was by JBG Smith Properties (JBGS) and Healthcare Realty Trust (HR) which respectively bought back 5.1% and 4.5% of outstanding shares. JBGS traded at an average NAV discount of -40.5% during Q2, allowing them to achieve a massive spread between repurchase price and NAV. SBA Communications (SBAC), NexPoint Residential Trust (NXRT) and Park Hotels & Resorts (PK) also had the opportunity to repurchase at significant discounts due to average Q2 NAV discounts of -35.7%, -28.4% and -28.2% respectively.
Source: S&P Global Market Intelligence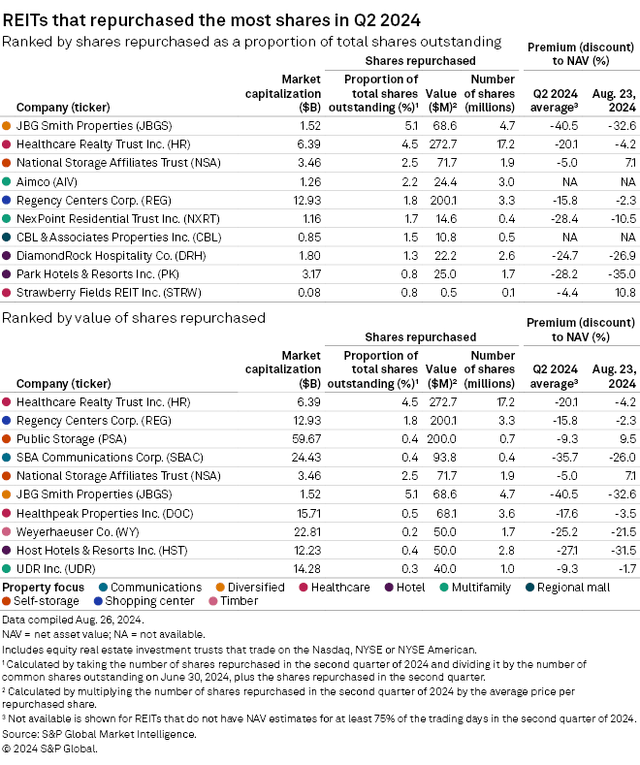
Even after 4 straight months of gains, the REIT sector remains attractively valued relative to the broader market. With 67.2% of REITs trading below net asset value, more upside remains for much of the sector. Dividend hikes, accretive share buybacks and strong property-level fundamentals present investors with the opportunity to capitalize on opportunistic valuations as the Fed initiates a rate cutting cycle that could serve as a powerful tailwind for REITs over the upcoming year.
Editor’s Note: This article covers one or more microcap stocks. Please be aware of the risks associated with these stocks.
Read the full article here