
Q1 2025 – Markets Down Modestly
Summary of the First Quarter
The S&P 500 fell during the first quarter, down -4.3%. Investors began to worry about tariffs, economic growth and consumer sentiment.
The Federal Reserve has put easing on hold as they wait to assess the impact of tariffs on the economy. Will the inflationary impact be transient or more durable?
Uncertainty surrounding the US tariff policy has caused businesses to pause on spending plans and consumer confidence has weakened, likely resulting in lower GDP growth for 2025. Current expectations call for GDP growth of 1.9% in 2025.


Sector Snapshot
Most sectors experienced a positive return in the first quarter with seven of the eleven sectors moving higher.
We saw a reversal of 2024 performance with the Technology, Consumer Discretionary, and Communication Services lagging in the first quarter while Energy, Healthcare, Consumer Staples and Utilities led the market.
Shifting Winds
Mixed Performance
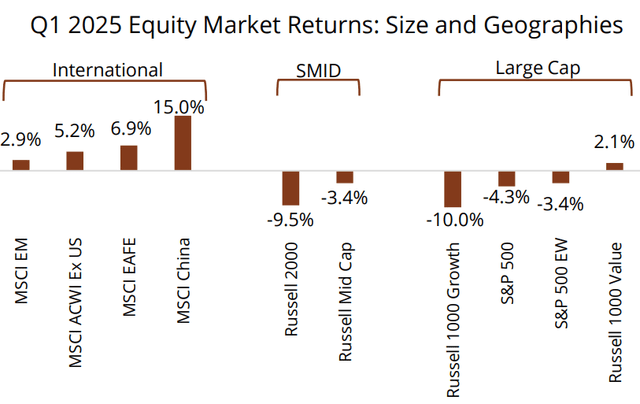
The first quarter brought a reversal of many of the themes driving markets the past two years. International markets outperformed US markets and Value outperformed Growth.
China was the best performing non-US market. However, despite China’s strong performance in emerging markets, developed international markets ultimately outpaced emerging markets in the quarter.
One familiar theme was large cap over both mid cap and small cap stocks within the US.
Volatility Spiked
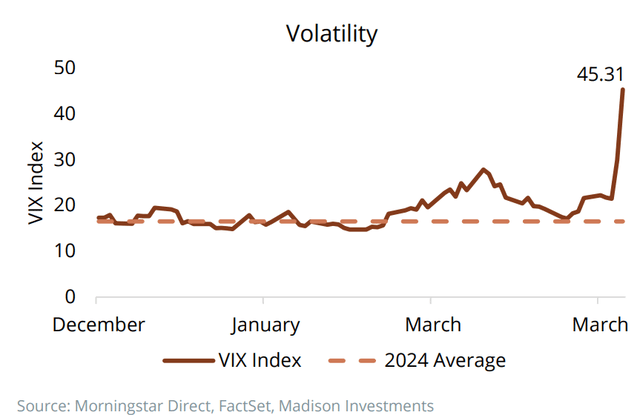
Market volatility as measured by the VIX Index began to move higher late in the quarter but spiked to 45 in early April as a result of the Liberation Day tariff announcements.
For context, the VIX spiked to 89.5 during the Great Financial Crisis, to 85.5 at the beginning of Covid, and to 65.7 early last August with the Japanese Yen Carry Trade induced sell off. We expect the VIX to remain above average while the Global Tariffs are renegotiated.
Policy Uncertainty Driven by Tariffs
Policy Uncertainty
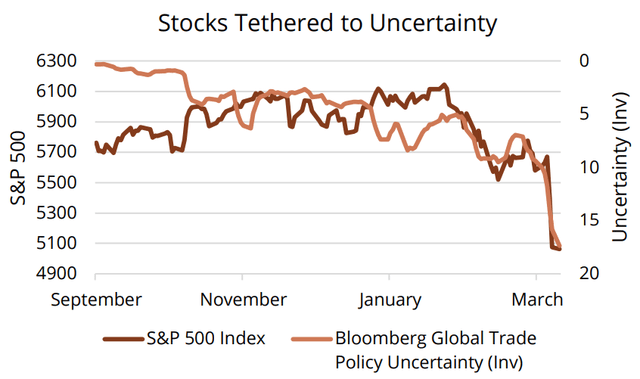
Uncertainty rose in the first quarter and we suspect into the second as markets try to understand the path of tariffs and the economy.
New tariff policies were announced on April 2 and resulted in equity markets sharply selling off.
Investors continue to look for clarity from the Administration (tariff policy), Congress (tax cuts) and the Federal Reserve (interest rate cuts).
Tariffs
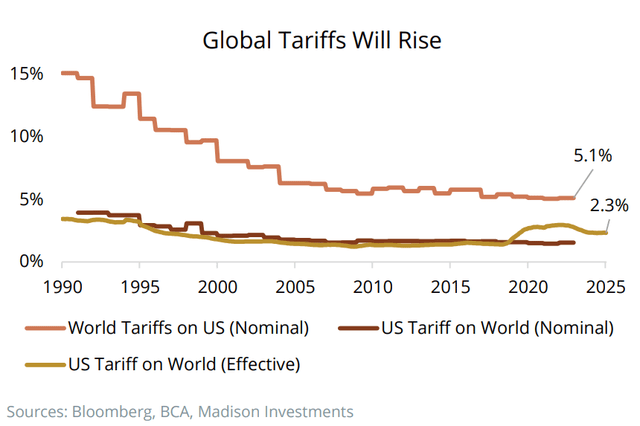
Tariffs on US goods charged by the rest of the world have consistently been higher than the tariffs charged by the US on imported goods, a difference that has varied little for much of the last 35 years.
With the announcement on April 2nd, the US tariff rate on imports will move substantially higher. The US announced a base tariff rate of 10% on all countries and then, announced further targeted rates.
The markets have not liked the announcements and investors, corporations, consumers and countries are all eager for clarity.
Expecting Stagflation?
Sources: Factset, Federal Reserve Bank of New York, Federal Reserve Bank of Atlanta, Madison Investments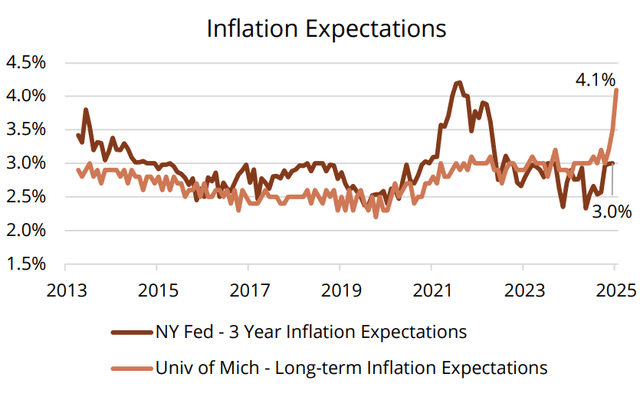
Inflation Expectations
Inflation expectations have started to rise. The long-term inflation expectations from the University of Michigan Survey of Consumers showed a sharp increase since the beginning of the year.
Contradicting this data point is the Federal Reserve Bank of New York’s consumer inflation expectations, which remain above the Federal Reserve’s 2% price stability target, however, is not exhibiting the same sharp increase.
First Quarter GDP Projected to be Light
Sources: Factset, Federal Reserve Bank of New York, Federal Reserve Bank of Atlanta, Madison Investments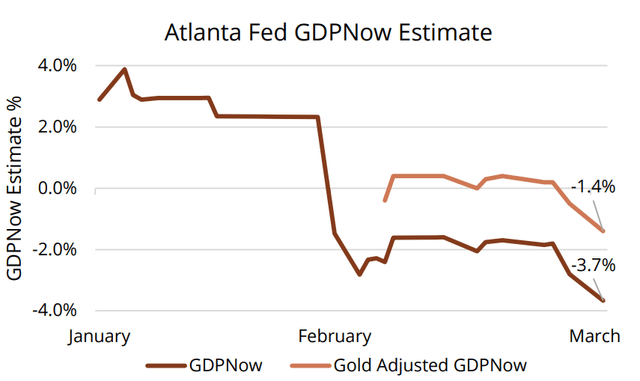
First quarter GDP as projected by the Atlanta Federal Reserve Bank is expected to be negative. Much of the slowdown in GDP growth is attributable to a pull forward in demand from tariffs as well as a large amount of gold that was transferred from vaults in Europe to vaults in the US to avoid tariffs.
Even when adjusted for the transfer of gold, first quarter GDP is expected to be -1.4%. GDP growth in 2Q and 3Q could also be weaker should the uncertainty around trade policy fail to recede, causing consumers and corporations to delay spending and capital investment.
What Will the Fed Do?
Summary of Economic Projections
Source: Factset, Federal Reserve, Madison Investments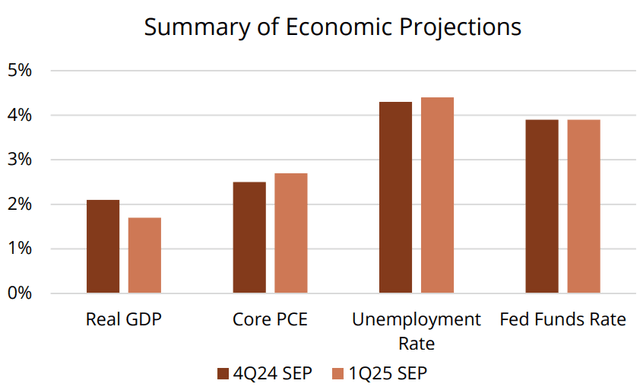
The Federal Reserve’s (Fed) latest Summary of Economic Projections (SEP) (issued before Liberation Day) indicated that they believe economic growth (Real GDP) will slow, while simultaneously anticipating inflation (Core PCE) to move higher and a modest increase in unemployment.
The Fed Funds rate forecast remained unchanged as the Fed messaged a pause to see where the economic data goes. The market, however, is expecting several rate cuts by year-end.
Leveling Off
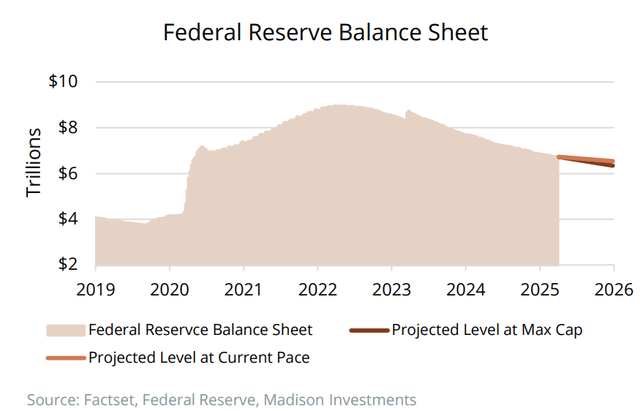
After reaching nearly $9 trillion in March of 2022, the Federal Reserve balance sheet has come down by over $2.2 trillion.
In March, the Fed announced a reduction to the amount of Treasuries they will allow to runoff their balance sheet each month from a cap of $25 billion to just $5 billion. No changes were made to their mortgage backed-security cap of $35 billion a month.
After three years of quantitative tightening, the Fed is likely to end their Treasury runoff this year, an incremental positive for the markets in addition to interest rate cuts.
Is the Honeymoon Over?
Sources: Factset, Madison Investments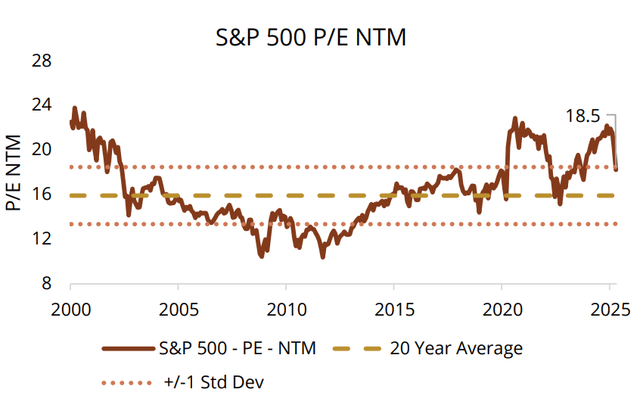
(Top Left) After over two years of multiple expansion, the S&P 500 began the year at 21.5x earnings. However, with the policy uncertainty and market volatility in the first quarter, equities moved lower with the P/E dropping to 18.5x. With lower confidence, we expect both businesses and consumers to reduce spending, resulting in lower earnings.
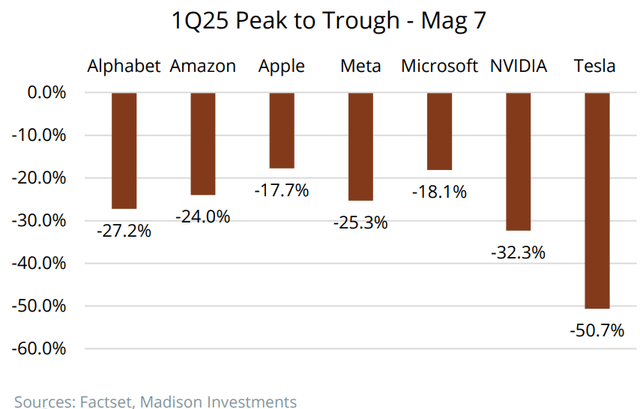
(Bottom Left) While the S&P 500 endured a 10% correction (peak to trough) during the quarter, and more downside early in the 2nd quarter, the Magnificent-7 stocks that had led the markets since late 2022, experienced a more dramatic de-rating.
(Bottom Right) The S&P 500 at 18.5x forward earnings isn’t as attractive as it appears as consensus estimates have remained at $269 in earnings per share for 2025, a figure we believe will ultimately prove to be too high.
S&P 500 Level Implied by Price to Earnings Combinations
|
Price/Earnings Multiple |
|||||||
|
S&P 500 Earnings per Share |
14x |
16x |
18x |
20x |
22x |
24x |
|
|
$310 |
4,340 |
4,960 |
5,580 |
6,200 |
6,820 |
7,440 |
|
|
$300 |
4,200 |
4,800 |
5,400 |
6,000 |
6,600 |
7,200 |
|
|
$290 |
4,060 |
4,640 |
5,220 |
5,800 |
6,380 |
6,960 |
|
|
$280 |
3,920 |
4,480 |
5,040 |
5,600 |
6,160 |
6,720 |
|
|
$270 |
3,780 |
4,320 |
4,860 |
5,400 |
5,940 |
6,480 |
|
|
$260 |
3,640 |
4,160 |
4,680 |
5,200 |
5,720 |
6,240 |
|
|
$250 |
3,500 |
4,000 |
4,500 |
5,000 |
5,500 |
6,000 |
|
|
$240 |
3,360 |
3,840 |
4,320 |
4,800 |
5,280 |
5,760 |
|
|
$230 |
3,220 |
3,680 |
4,140 |
4,600 |
5,060 |
5,520 |
|
Fixed Income Executive Summary
Market Summary (1Q25)
- The first quarter brought significant volatility across asset classes as investors sought to interpret a steady stream of budget, trade, and geopolitical headlines.
- The U.S. economy showed signs of slowing as consumption decreased and employment growth subsided. Inflation remained near 3% and could move higher given the recently imposed tariffs.
- Credit spreads widened as corporations lowered earnings guidance in response to lackluster consumer spending. Businesses also appear to be wary of expansion given vast uncertainties about tax cuts, deregulation, and trade policies.
- Treasury yields finished the quarter lower with 3-month, 2-year, and 10-year maturities falling by -0.02% to 4.31%, -0.36% to 4.24%, and -0.36% to 4.57%, respectively.
- During the quarter, A-rated corporate bond spreads rose 10 basis points (bps) while BBB-rated spreads rose by 17 bps. The average spread on corporate bonds rose 13 bps to 86 bps.
Matters Madison Fixed Income Are Monitoring
- U.S. economic growth is slowing, and the recently imposed tariffs could hasten the descent towards recession. The employment situation remains solid, although job dismissals will probably rise in the coming months. Although Inflation concerns have risen, it is too early to gauge the potential severity of rising import prices. At the beginning of the year, two 25 bps rate cuts by the Federal Reserve seemed plausible. However, the economy now appears susceptible to downside risk and the Fed may find it necessary to respond more aggressively despite above target inflation.
- Consumer finances are in good condition, though evidence of depleted savings, increased use of credit, and an upturn in delinquencies are cause for concern. Stock market volatility has the potential to disrupt consumer spending patterns.
- Asset-backed and mortgage-backed securities currently offer the most attractive risk-adjusted return potential. However, Treasuries would be the preferred sector for return generation should investors reposition into safe-haven assets amidst market turmoil.
1Q 2025 – Fixed Income Attribution
Attribution Comments
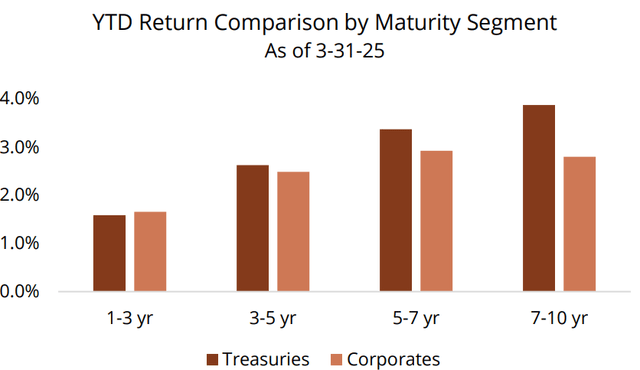
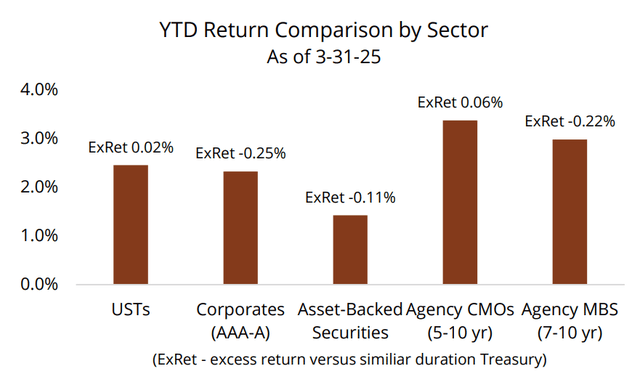
Intermediate investment grade bonds posted returns exceeding 2% as the Treasury curve shifted lower in response to concerns about prospects for slower economic growth. Treasury yields for bonds maturing between 3- and 10-years fell 35 bps to 40 bps. As shown below, the yield shift resulted in longer maturities outperforming shorter maturities. Corporate bond returns lagged Treasury performance as spreads increased by an average of 13 bps.
In terms of sector performance (bottom right), Treasuries generated better returns than most spread products. Agency CMOs provided positive excess return due to a longer average life and cash flow stability attributable to their bond structure.
Source: Madison, Bloomberg, ICE Global Indices Source: Madison, Bloomberg, ICE Global Indices Source: Madison, Bloomberg, ICE Global Indices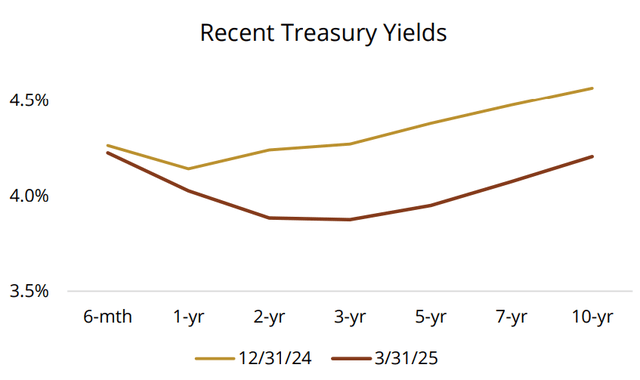
Macro Commentary
The Service Sector Continues to Drive Inflation
Core inflation (which excludes food and energy) appears to have stabilized just below 3%. Recent price increases are due mainly to the Services sector with Housing accounting for 27% of inflation and other services accounting for 69% of inflation. The remaining 4% is attributable to the Goods sector which in January ended its 13-month period of disinflation.
The U.S. tariffs imposed worldwide are apt to increase prices over the near-term given the amount of our nation’s imports for both intermediate goods (used in the manufacturing process) and finished products. At this point, it’s unknown whether tariffs will result in a one-time price rise or an elevated level of inflation over time.
Source: Madison, Bloomberg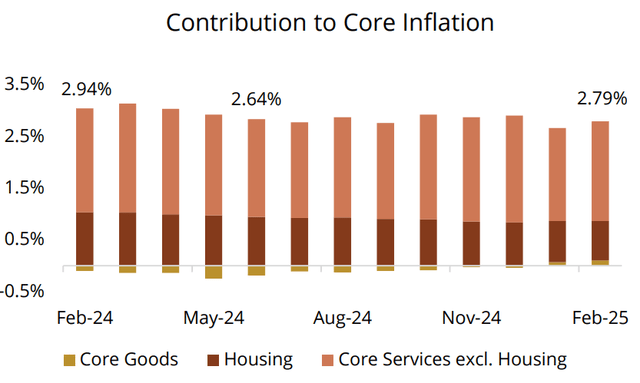
The Jobs Market is Holding Steady
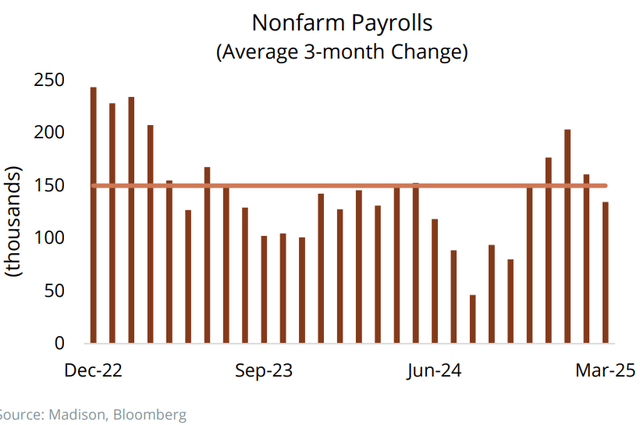
Private employers continue to add jobs, albeit at a slower pace. The 4.2% unemployment rate reported for March is likely to rise in the near-term as companies prepare for a potential period of slower growth. In addition, the number of federal workers dismissed will probably increase in the coming months.
Barring a significant rise in unemployment, the Federal Reserve is expected to base policy decisions primarily on its 2.0% inflation target. However, should economic reports point towards a recession, the Fed may find it necessary to act preemptively by aggressively lowering rates in hopes of stimulating the economy.
Treasury Debt Has Increased As The Trade Deficit Grows
Persistent federal budget deficits (i.e. government spending exceeds revenues) have been the root cause of mounting federal debt, although U.S. trade deficits are a contributing factor.
A strong U.S. economy and dollar have enabled both consumers and businesses to buy cheaper goods and source attractively priced manufacturing inputs. Since U.S. exports rarely keep pace with imports, trade imbalances are typically financed by a combination of foreign investment into U.S. assets or borrowing from foreign lenders. The latter generally adds to national debt. We believe tariffs are unlikely to decrease U.S. debt in a meaningful way.
Source: Madison, Bloomberg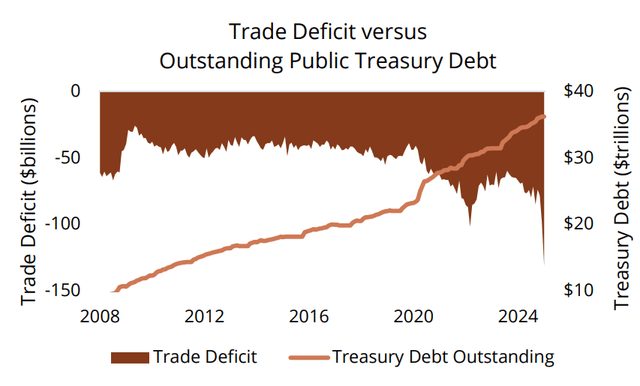
U.S. Tariffs Heighten Recession Risk
Source: Madison, Bloomberg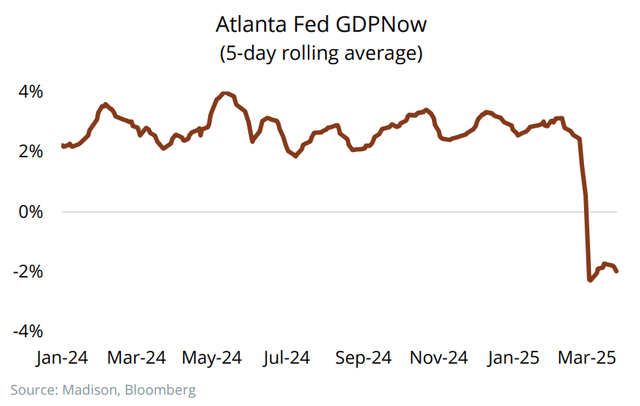
In late February, an announcement about forthcoming tariffs triggered a collapse in economic growth expectations. The Atlanta Federal Reserve Bank GDPNow forecast fell into recession territory.
Although it’s rare for the GDPNow forecast to accurately predict GDP, the measure tends to be directionally correct. Currently, we foresee an economic slowdown and the potential for a recession. Should a recession occur, we believe the growth slowdown is prone to be shallow and short-lived.
Asset Class (Governments)
U.S. Tariffs May Approach A Level Last Seen In The 1930s
The effective U.S. tariff rate is apt to rise above 10% this year, barring significant concessions from the incumbent administration. U.S. tariffs were previously near this level during the 1930s, a much different period in terms of economic conditions and global unrest.
The newly enacted tariffs will undoubtedly increase prices in the short run and likely result in diminished economic activity.
Source: Madison, Bloomberg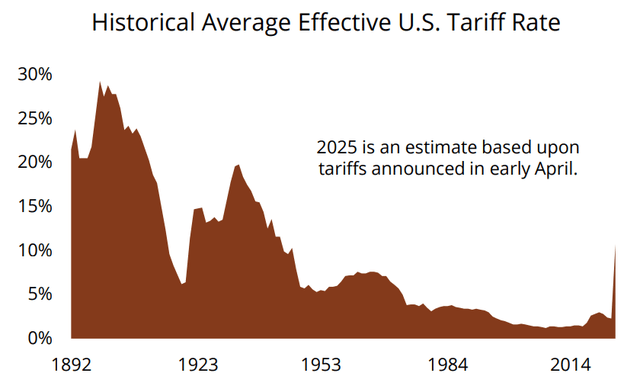
The Fed Has Become More Concerned About both Unemployment and Inflation
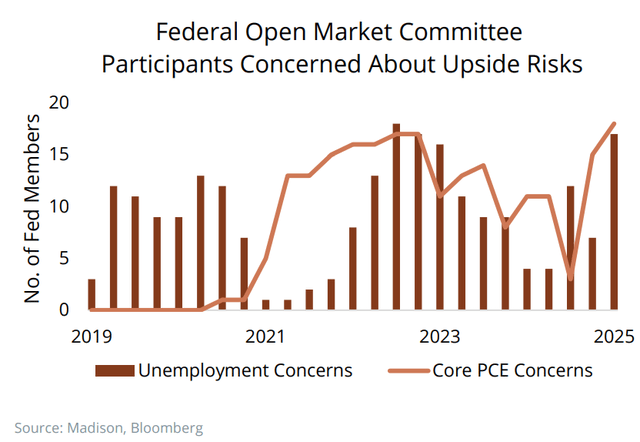
In March, Fed officials updated their summary of economic projections which revealed concerns about slower growth, weaker employment, and higher inflation.
The central bank’s GDP estimates for 2025 and 2026 were lowered to 1.7% and 1.8%, respectively. Their unemployment estimate for 2025 rose from 4.3% to 4.4% while their core inflation projection for 2025 rose from 2.5% to 2.8%.
We sense the Fed will find it difficult to lower rates more than 0.50% this year unless unemployment spikes upward or inflation declines further. We’re aware the Fed could respond more aggressively should the economy enter a recession.
Asset Class (Corporates)
Corporate Issuers Appear Financially Sound Despite Weaker Interest Coverage and Leverage Ratios
In general, investment grade corporate issuers have reasonable balance sheets and income statements heading into what appears to be an economic downturn. The chart at right using data from S&P Capital IQ shows recent trends for both interest coverage and leverage ratios. Although slight deterioration is evident since 2022, both ratios remain stronger than many past periods.
EBITDA Interest Coverage = Earnings Before Interest, Taxes, Depreciation and Amortization / Total Interest Payment
Source: Madison, Bloomberg, ICE Global Indices, S&P Capital IQ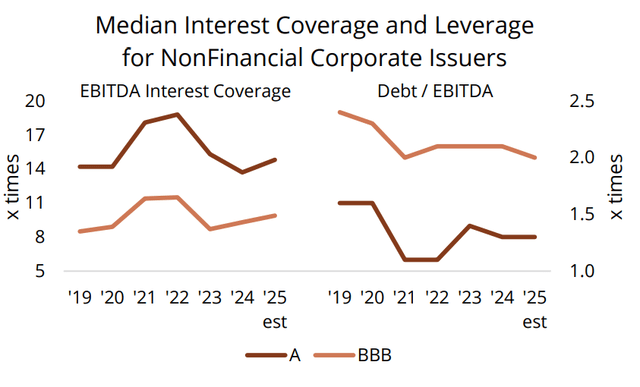
Economic Concerns Have Caused Corporate Risk Premiums To Inch Higher
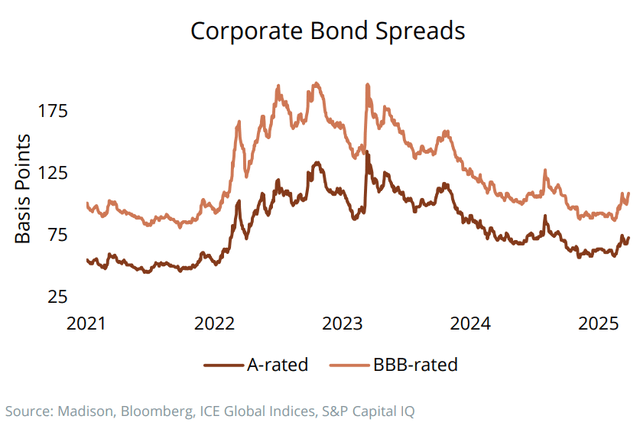
Investment grade corporate bonds spreads increased 13 bps during the first quarter as investors repositioned assets over concerns about a slowing economy due to the recently announced trade policies.
Risk premiums remain low from a historical standpoint and changing economic conditions amplify the risk spreads will move higher. Spread volatility may provide opportunities to position high quality corporate bonds at reasonable valuations. Our focus remains on issuers with strong financial profiles whose industries are less sensitive to economic conditions.
Asset Class (ABS/MBS & High Yield)
A Weakening Economy May Impact Mortgagees
Source: Madison, Bloomberg, ICE Global Indices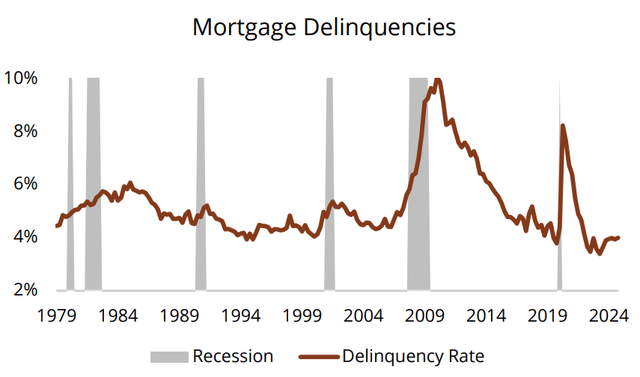
Households tend to be among the first to show signs of economic distress as financial flexibility diminishes with job loss and lower bank balances. Mortgage delinquencies have risen to 4.0% after attaining a historic low of 3.4% in mid-2023. The combination of higher home prices and interest rates have made many borrowers vulnerable to economic downturns.
In our view, mortgage delinquencies are predisposed to creep upward should the economy in fact slow. To minimize principal loss due to prepayment, agency-backed residential mortgage investors are wise to position bonds trading near par or at discounted prices.
Below Investment Grade Risk Premiums Do Not Reflect The Potential For Slower Economic Growth
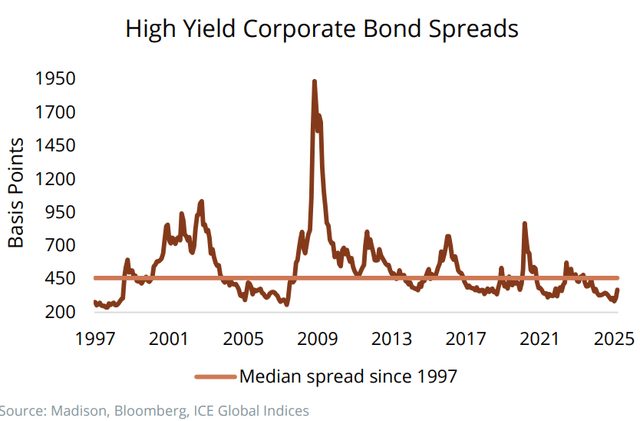
Risk premiums on high yield bonds shifted upward by 62 bps during the quarter. The average 371 bps spread remains below the long-term median and average spreads of 459 and 520, respectively. To us, this suggests high yield investors are not anticipating a substantial surge in defaults should the economy falter.
Many high yield issuers lengthened debt maturities during the past few years and are somewhat protected from near-term refinancing risk. Recessionary conditions, however, could impact the ability for some issuers to service outstanding debt. In the near term, BB-rated paper in less economically sensitive industries is our preferred choice.
Asset Class (Sector Valuations)
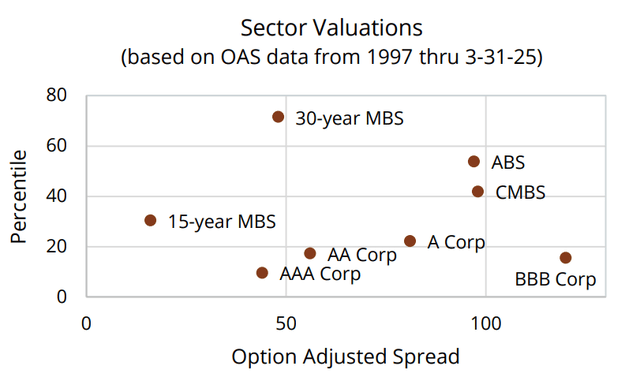
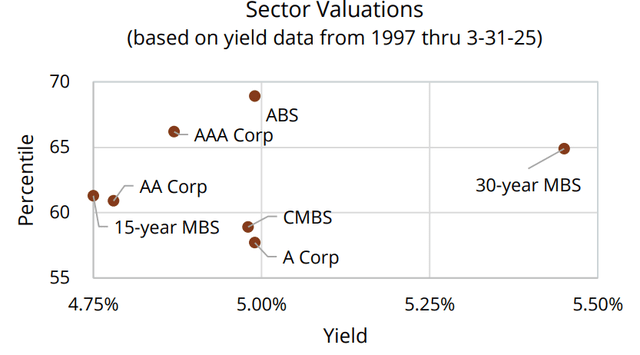
Valuation Comments
Structured products (i.e. mortgage-backed securities, asset backed securities) currently offer the best relative value based on a combination of percentile rank for both option-adjusted spread (OAS) and yield (see chart at right).
Though corporate bond spreads widened during the quarter, OAS valuations remain near or below the 20th percentile rank meaning spreads are higher roughly 80% of the time versus current levels (see chart at bottom left).
As shown at bottom right, structured product with yields above the 60th percentile appear attractive. Even corporate bonds appear compelling at yields above the 55th percentile.
Source: Madison, Bloomberg, ICE Global Indices Source: Madison, Bloomberg, ICE Global Indices Source: Madison, Bloomberg, ICE Global Indices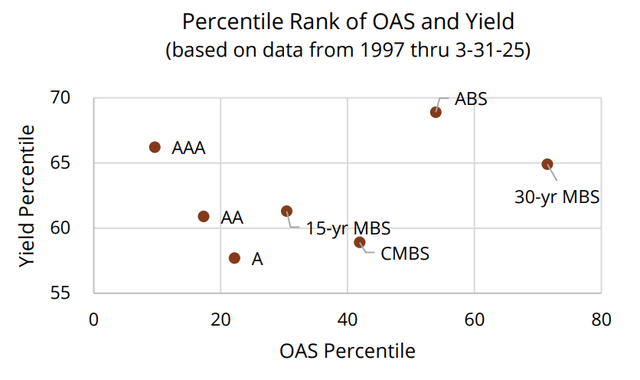
Fixed Income Scorecard
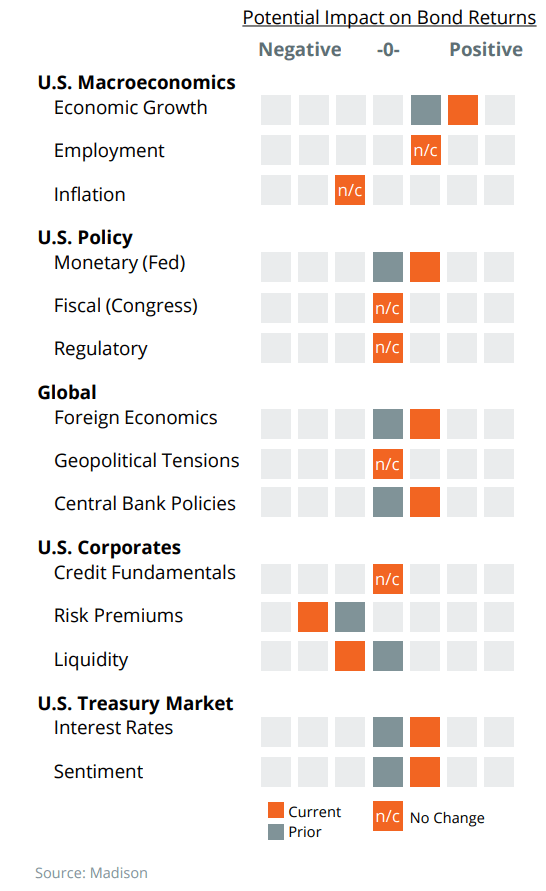
U.S. growth is likely to slow in the coming quarters should consumer spending drop due to depleted bank balances and higher prices on imported goods. Weaker economic activity would lead to layoffs and an uptick to the rate of unemployment. Inflation may move higher than 3% as tariff effects take hold.
Fed policy continues to be data-driven, although elevated uncertainties may cause the central bank to preemptively cut rates to ward off a recession. It’s too early to assess ramifications of fiscal policy, although U.S. debt could expand in the short term. Meaningful regulatory change could occur once DOGE completes its efficiency project.
The announced level of worldwide tariffs will likely cause international growth to fall below the previous 3% forecast. Should a severe global trade war ensue all economies would suffer, making U.S. Treasury securities a preferred asset to hold for investors seeking protection against volatility within risk markets.
The recent rise in credit spreads suggests mounting concerns about the impact of tariffs which could cause profitability and free cash flow to decline for many industrial companies. Given strong balance sheets, most companies would survive a recession. The Financial sector could also manage through a difficult downturn given abundant capital levels.
Treasury market volatility is expected to continue as the U.S. economy is reshaped in response to U.S. policy positions (e.g. tariffs, fiscal spending, tax legislation). Short-term rates will be influenced by Fed policy while inflation and term premium (i.e. the additional yield to compensate investors for lending over longer periods) are apt to influence longer rates.
|
Disclosures “Madison” and/or “Madison Investments” is the unifying tradename of Madison Investment Holdings, Inc., Madison Asset Management, LLC (“MAM”), and Madison Investment Advisors, LLC (“MIA”). MAM and MIA are registered as investment advisers with the U.S. Securities and Exchange Commission. Madison Funds are distributed by MFD Distributor, LLC. MFD Distributor, LLC is registered with the U.S. Securities and Exchange Commission as a broker-dealer and is a member firm of the Financial Industry Regulatory Authority. The home office for each firm listed above is 550 Science Drive, Madison, WI 53711. Madison’s toll-free number is 800-767-0300. Any performance data shown represents past performance. Past performance is no guarantee of future results. Non-deposit investment products are not federally insured, involve investment risk, may lose value and are not obligations of, or guaranteed by, any financial institution. Investment returns and principal value will fluctuate. This report is for informational purposes only and is not intended as an offer or solicitation with respect to the purchase or sale of any security and is not investment advice. Although the information in this report has been obtained from sources that the firm believes to be reliable, we do not guarantee its accuracy, and any such information may be incomplete or condensed. All opinions included in this report constitute the firm’s judgment as of the date of this report and are subject to change without notice. Indices are unmanaged. An investor cannot invest directly in an index. They are shown for illustrative purposes only, and do not represent the performance of any specific investment. Index returns do not include any expenses, fees or sales charges, which would lower performance. All investments contain risk and may lose value. Equities may decline in value due to both real and perceived general market, economic and industry conditions. Investing in foreign-denominated and/or -domiciled securities may involve heightened risk due to currency fluctuations, and economic and political risks, which may be enhanced in emerging markets. In addition to the ongoing market risk applicable to portfolio securities, bonds are subject to interest rate risk, credit risk and inflation risk. When interest rates rise, bond prices fall; generally, the longer a bond’s maturity, the more sensitive it is to this risk. Credit risk is the possibility that the issuer of a security will be unable to make interest payments and repay the principal on its debt. Bonds may also be subject to call risk, which allows the issuer to retain the right to redeem the debt, fully or partially, before the scheduled maturity date. Proceeds from sales prior to maturity may be more or less than originally invested due to changes in market conditions or changes in the credit quality of the issuer. Upon request, Madison may furnish to the client or institution a list of all security recommendations made within the past year. Definitions The S&P 500® is an unmanaged index of large companies and is widely regarded as a standard for measuring large-cap and mid-cap U.S. stock-market performance. Results assume the reinvestment of all capital gain and dividend distributions. An investment cannot be made directly into an index. The Russell 2000®Index measures the performance of the 2,000 smallest companies in the Russell 3000® Index, which represents approximately 11% of the total market capitalization of the Russell 3000® Index. The Russell Midcap® Index measures the performance of the 800 smallest companies in the Russell 1000® Index, which represent approximately 35% of the total market capitalization of the Russell 1000® Index. As of the latest reconstitution, the average market capitalization was approximately $3.7 billion; the median market capitalization was approximately $2.9 billion. The largest company in the index had an approximate market capitalization of $10.3 billion. The Russell 1000® Growth Index is designed to track those securities within the broader Russell 1000 Index that FTSE Russell has determined exhibit growth characteristics. The Russell 1000® Value Index is designed to track those securities within the broader Russell 1000 Index that FTSE Russell has determined exhibit value characteristics. The MSCI Emerging Markets Index captures large and mid cap representation across 24 Emerging Markets (EM) countries. With 1,138 constituents, the index covers approximately 85% of the free float-adjusted market capitalization in each country. The MSCI EAFE (Europe, Australasia & Far East) Index is a free-float adjusted market capitalization index that is designed to measure developed market equity performance, excluding the U.S. and Canada. The MSCI ACWI ex USA Index captures large and mid cap representation across 22 of 23 Developed Markets countries (excluding the US) and 23 Emerging Markets countries. With 1,843 constituents, the index covers approximately 85% of the global equity opportunity set outside the US. The MSCI China Index captures large and mid cap representation across China A shares, H shares, B shares, Red chips, P chips and foreign listings (e.g. ADRs). The VIX Index is a calculation designed to produce a measure of constant, 30-day expected volatility of the U.S. stock market, derived from real-time, mid-quote prices of S&P 500® Index (SPXSM) call and put options. A basis point is one hundredth of a percent. Yield Curve is a line that plots yields (interest rates) of bonds having equal credit quality but differing maturity dates. The slope of the yield curve gives an idea of future interest rate changes and economic activity. There are three main types of yield curve shapes: normal (upward sloping curve), inverted (downward sloping curve) and flat. Bond Spread is the difference between yields on differing debt instruments of varying maturities, credit ratings, and risk, calculated by deducting the yield of one instrument from another. Income from tax-exempt bonds may be subject to the federal Alternative Minimum Tax and state and municipal taxes. Federal funds rate is the target interest rate range set by the Federal Open Market Committee (FOMC) for banks to lend or borrow excess reserves overnight. It influences monetary and financial conditions, short-term interest rates, and the stock market. Option-adjusted spread(OAS) measures the difference in yield between a bond with an embedded option (e.g. callable bonds, mortgage-backed securities) with the yield on Treasuries. Percentile Rank is a statistical measure that indicates the relative standing of a value within a dataset. As an example, a sector with an OAS of 35 and a percentile rank of 25 indicates that historically the OAS has been below 35 twenty-five percent of the time and above 35 seventy-five percent of the time. |
Original Post
Editor’s Note: The summary bullets for this article were chosen by Seeking Alpha editors.
Read the full article here