
Won’t Get Fooled Again ¹

In our 4Q25 investor letter,² we noted that Trump 2.0 ranked as the seventh-most disruptive period among 35 episodes over the last 200 years.³ The most important conclusion from the study was that disruption alone does not create crisis. The dividing line between turbulence and crisis is whether capital markets remain liquid and whether credit continues to be available. As long as liquidity held, we believed the economy and markets could absorb a remarkable amount of policy uncertainty, geopolitical stress, and technological change. Since then, the military conflict involving the U.S., Israel, and Iran has materially increased disruption – testing that framework.
A familiar lesson of the current oil shock is not merely that war drives prices higher. It is that when supply chains are threatened and immediate physical delivery becomes scarce, markets begin to reprice liquidity itself. That matters far beyond energy. In 4Q25, we argued that rich asset prices and tight credit spreads would need to adjust for greater tail risk, rising capital demands, and a world being rewired by AI and on-shoring. Now, these adjustments are no longer theoretical. Won’t Get Fooled Again is therefore not simply a comment on politics or history. It is a warning to investors not to mistake abundant liquidity for durable value, tight spreads for adequate compensation, or temporary calm for the absence of risk. We won’t get fooled again.
“We’ll Be Fighting in the Streets”
Brent Crude: Dated Brent Spot vs ICE Front Month Futures⁴A (% Differential of Spot vs Futures)
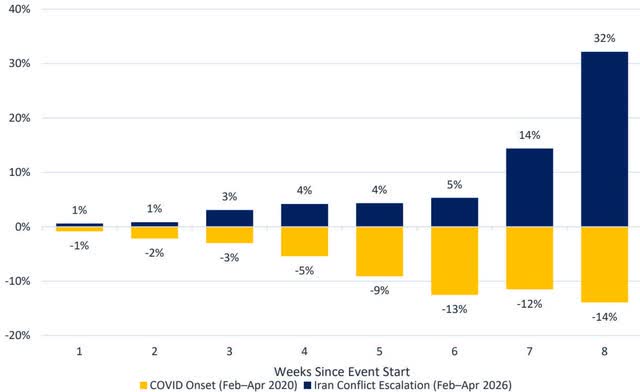
Oil markets have a funny way of getting right to the point. The chart above compares dated Brent, which reflects the price of crude for prompt physical delivery, with front month ICE Brent futures, which are essentially a paper claim on later delivery. ⁵ In normal markets, that spread is small and usually not worth much discussion. In stressed markets, however, it can tell you a great deal. Sometimes the problem is too much oil. Sometimes it is too little oil. And sometimes, as now, the problem is that oil you can get today is worth a lot more than oil you are merely promised tomorrow.
That is exactly what the graph above shows. During the COVID crash, demand collapsed, storage filled, and physical barrels became hard to place. Futures traded above spot, producing extreme contango. ⁶ During the current conflict, the opposite has happened. Dated Brent has moved sharply above front-month futures, producing extreme backwardation. ⁷ In plain English, the market is paying up for immediate delivery. Barrels on the water (outside of the Strait of Hormuz) are worth more than barrels on paper. As of March 31, 2026, dated Brent was priced at $118.35 per barrel, 13.8% above front-month futures.B According to the Wall Street Journal , that premium later widened to roughly 34% on April 13, 2026.C
Summary of Dated Brent vs ICE Brent Front Month FuturesD
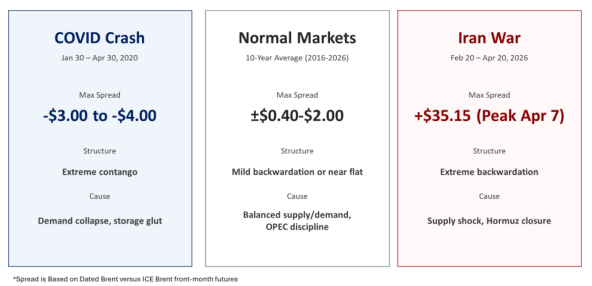
The table above makes this point easy to see. In normal markets, the spread between spot and front-month futures is usually narrow, often near flat or in mild backwardation. But this is not just oil going up. It is the market assigning greater value to immediacy and physical availability. History suggests oil shocks are most economically damaging when they are supply-driven, persistent, and strike an economy already contending with inflationary pressure or tightening financial conditions.E
That matters because these things rarely stay neatly contained in crude oil. When markets start separating financial exposure from physical access, investors should pay attention. It usually means liquidity is becoming more valuable and harder to take for granted. In this case, the immediate issue is the risk to oil flows through the Strait of Hormuz, through which roughly one quarter of global seaborne oil trade passes. Iran has shown that it can threaten that route at relatively low cost through asymmetric tactics, ⁸ and the prompt barrel is now reflecting the price of that risk.
Market Price of Polyethylene, Urea, Asphalt and Other Petroleum and Coal ProductsF (Price = 100 at 1/2/26)
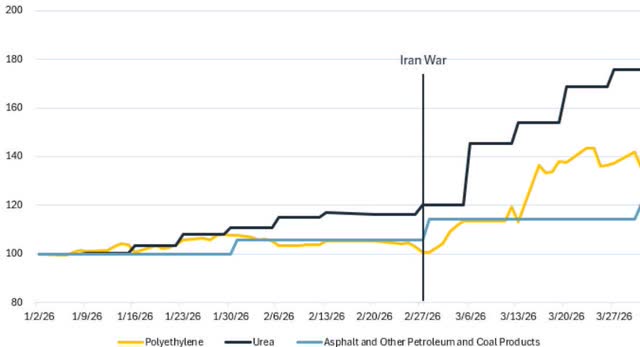
The chart above shows that process already at work. Indexed to 100 at January 2, 2026, it tracks the prices of polyethylene, urea, and asphalt-related petroleum and coal products through March 31, 2026. All three moved higher over the period. The point is not that these products move in lockstep every day. They do not. The point is that higher energy costs and supply risk are already working their way into important industrial materials.
And these are not niche products. Polyethylene is a key input for packaging, construction materials, and consumer goods. Urea is essential for fertilizer production. Asphalt is the primary input for road paving and roofing. Once those prices start rising, the effects do not stay in the energy complex. They spread into food, infrastructure, manufacturing, and housing. That is how an oil shock becomes a broader inflation story.
The global economy is less oil-dependent than it was in the 1970s. Bank of America estimates that the world now requires roughly one third of the oil to produce the same level of GDP as it did then.G The U.S. has also been a net exporter of energy since 2019.H All true, but that only goes so far. Oil and gas still sit upstream of a remarkable number of goods the economy uses every day. Consumers still feel the shock quickly: according to AAA, the average price of gasoline in the U.S. rose from $2.98 per gallon on February 26, 2026 to $4.08 on April 2, 2026.I And the knock-on effects can last longer than many expect. The International Energy Agency has described the war as “creating the largest supply disruption in the history of the global oil market.”J So while the economy may be less oil-intensive than it once was, it is hardly immune to a major energy shock.
Even the parts of the economy most associated with the future are not exempt. Helium, which is critical to semiconductor production, is also at risk, with Qatar accounting for roughly 35% of global output.K If conflict damages infrastructure or keeps the region unstable for an extended period, the result is not just a temporary spike in oil. It is a higher cost structure for a wide range of industries and another headwind for a global supply chain that has already spent the better part of this decade reminding us that “efficient” and “resilient” are not the same thing.
There is also a broader lesson here. Iran does not need to win a conventional military victory to impose meaningful economic costs. It only needs to disrupt confidence in the steady movement of oil and goods through a critical chokepoint. ⁹ Markets understand this. That is why the prompt barrel is suddenly worth so much more than the paper barrel. Investors should understand it too. When the market starts paying a premium for immediacy, it is usually a sign that liquidity is getting dear and complacency is getting expensive.
And that point extends well beyond energy. The world that is now paying up for prompt barrels of oil is also being asked to fund AI infrastructure, data centers, semiconductors, and the electricity buildout needed to support them. In both cases, the question is not whether demand is real. It is whether markets have adequately priced the cost of the capital, resources, and liquidity required to meet it. Oil shocks and AI buildouts are obviously different problems, but they share one important feature: both force markets to confront the real cost of scarce resources. That is where we turn next.
“The Hypnotized Never Lie”
Artificial intelligence is often described as if it were weightless – just software, models, and computing magic floating in the cloud. It is not. AI requires power, chips, data centers, cooling, transmission, and, perhaps most importantly, a great deal of capital. So, while AI promises abundance, it is being built on top of some very old-fashioned scarcities. That matters for the economy, and it matters for investors.
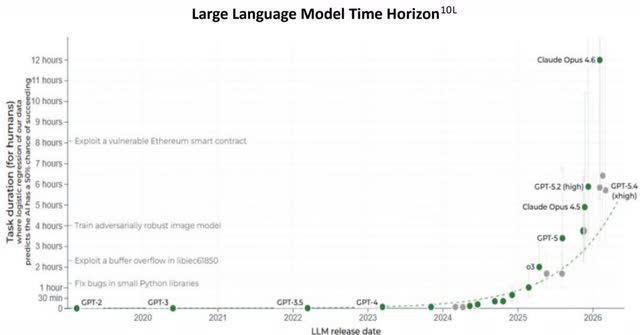
The chart above helps explain why enthusiasm has been so intense. Large language models are improving rapidly, with the ability to complete increasingly complex software tasks over shorter time horizons. There is little doubt that the technology is becoming more capable and more useful. It will lead to real efficiency gains in routine work, open up new ways to solve problems, and, over time, reach further into the physical world through robotics and other forms of embodied AI. That part of the story is real, and investors are right to take it seriously.
But every technological revolution comes with a bill, and somebody eventually has to pay it. Some business models will benefit from AI, some will be pressured, and some may simply disappear. Jobs built around repetitive human tasks are already being challenged. Enterprise software models tied to headcount-based pricing are beginning to look less secure. More broadly, the infrastructure required to support AI is putting real stress on resources and the economy’s plumbing. Rising electricity demand, tied in part to AI data centers contributed to higher retail power prices in Virginia and Maine in 2025, and policymakers have already begun responding. ¹¹ AI may be new, but the laws of supply and demand remain stubbornly old.
Who will actually earn durable returns once the cost of capital, competition, and infrastructure is fully taken into account? Markets have a long history of correctly identifying transformative technologies while being far less accurate in identifying the eventual long-term winners. The internet changed the world. That did not mean every early internet leader proved to be a good investment.
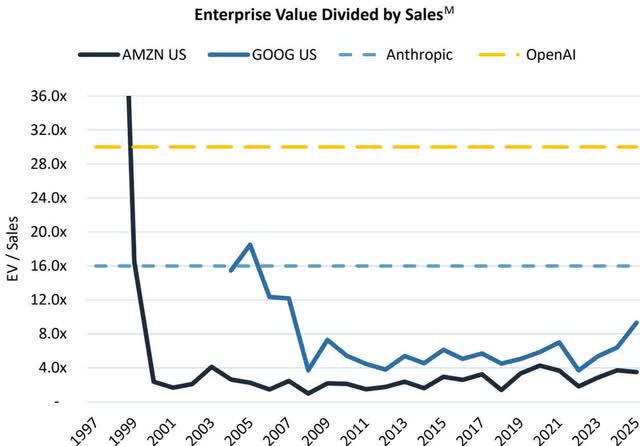
The valuation chart above makes that point in a more familiar market language. After their IPOs, Amazon (AMZN) and Alphabet saw valuation multiples decline sharply even as revenues grew dramatically. That is not a criticism of those businesses. Quite the opposite. It is a reminder that great companies and great investments are not always the same thing at the same time. Revenues can scale, industries can mature, and the market can still decide that yesterday’s multiple was too generous. Today, Anthropic and OpenAI appear to occupy the role of early leaders in the AI buildout and have attracted private capital at valuations that invite comparisons to the early days of Amazon and Google. That may prove prescient. It may also prove optimistic in ways investors only recognize later.
Investors were once equally enthusiastic about AOL, Netscape, and other early movers that are now footnotes or shadows of what they once were. That does not mean today’s AI leaders are destined to suffer the same fate. It does mean the burden of proof should remain high. The relevant question is not simply who is ahead today. It is whether any given company has a durable advantage, the ability to keep adapting, and a path to returns that justify the enormous amount of capital now flooding into the space. If large language models become increasingly commoditized, the market may end up looking less like a winner-take-all revolution and more like an oligopoly in which a handful of very smart firms compete intensely while investors earn less than they expected.
There is also the possibility that the competitive landscape shifts in ways few are currently pricing. Quantum computing has the potential to both accelerate AI capabilities and dislocate the infrastructure being built to support it today – complementing today’s winners or rendering parts of their advantage obsolete almost simultaneously. Early leadership in a fast-moving technological cycle has never guaranteed lasting dominance, and the pace of change here is faster than most investment models assume.
For investors, the lesson is not to dismiss AI. It is to separate technological excitement from investment discipline and not get fooled by novelty into ignoring price, capital intensity, and competition. However, history suggests that when a technology is both transformative and capital-hungry, the market often gets two things wrong at the same time: it underestimates the cost of building the future and overestimates how many companies will earn exceptional returns from doing so. Regardless, price matters.
When a market is flush with enthusiasm, capital is often extended most freely to the businesses and sectors that appear to have the brightest future. But when the cost of capital rises, liquidity tightens, or business models come under pressure, the difference between a temporary markdown and a permanent impairment starts to matter a great deal. That is where we turn next.
“The World Looks Just the Same”
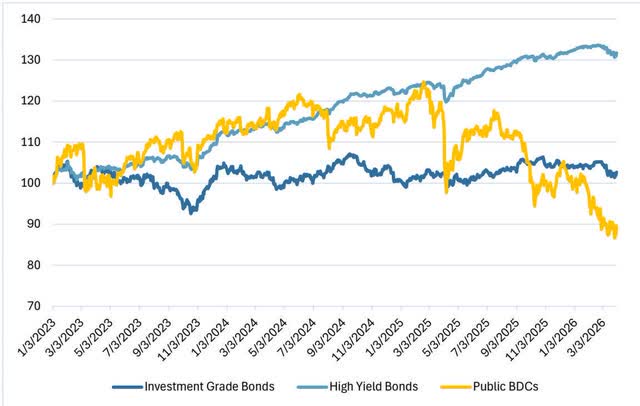
Performance of Investment Grade Bonds, High Yield Bonds and Business Development Companies (BDCs)N
(Indexed total return performance at 1/3/23 = 100)
Private credit has become one of those asset classes that sounds novel until you remember that life insurance companies and other long-horizon investors have been doing versions of it for a very long time. ¹² The basic bargain has always been the same: give up some liquidity and, in exchange, pick up some yield. That trade looked especially attractive in the low-rate world that followed the pandemic when fixed income investors were hungry for income with low volatility and managers were more than happy to provide it (for a fat fee) in every shape and wrapper imaginable. Public and private BDCs (Business Development Companies), interval funds, and other private credit vehicles did not suffer from a shortage of demand.
The chart above shows how quickly enthusiasm can cool when investors begin to worry about liquidity and credit quality at the same time. Since early 2025, publicly traded BDCs have sold off meaningfully, while investment grade and high yield bonds have been much steadier. That contrast matters. If credit conditions were broadly collapsing, one would expect more damage across the public fixed income markets as well. Instead, the sharp decline in BDCs looks less like a verdict on the entire credit complex and more like a market repricing a structure that promised yield, limited transparency, and only partial liquidity right up until investors decided they wanted more of each.
Investors in private vehicles face a different version of the same problem. They often discover, at the precise moment they would most like to exit, that the fund documents give managers the ability to slow, limit, or gate withdrawals. That is frustrating, but it may also prevent a bad situation from becoming worse. Public BDC investors get the daily liquidity they say they want, but they also inherit the liquidity needs, fears, and timing of everyone else. Private fund investors lose that flexibility, but they may be spared the sort of self-inflicted damage that comes from selling into a panic. One structure offers the freedom to leave; the other may offer a better chance of not leaving at exactly the wrong time.
That brings us to an old but important distinction in credit: the difference between a mark-to-market loss and a permanent impairment . Mark-to-market losses are price declines caused by changing sentiment – people getting more nervous – or temporary economic weakness. Permanent impairments are different. Those occur when a business model breaks, leverage becomes unsustainable, or a restructuring leaves creditors with less than they expected. Unless we are headed into a much deeper economic downturn, the relative stability of investment grade and high yield bonds suggests that many BDC and private credit investors may be converting fears of mark-to-market losses into permanent impairments by selling at distressed prices. That is usually a poor trade.
There is also a broader portfolio management point here. Illiquidity in private credit is not a bug; it is part of the product. The problem arises when investors treat an illiquid asset as though it were a liquid one until proven otherwise. By its nature, private credit is best suited to investors with long time horizons, stable capital, and the temperament to withstand periods of stress without reaching for the exit. Publicly traded BDCs offer a version of private credit with daily liquidity, but that convenience comes at a cost: one can be forced to live with everyone else’s emotions. Private funds avoid some of that problem by limiting withdrawals, but managers and investors still have to be honest about what they own and how quickly it can be turned into cash. As managers of open-ended fixed income funds, we think about that mismatch every day. The difference is that we try to manage it deliberately by sizing positions carefully, controlling duration, and focusing on public high yield and syndicated loans that we can sell securities, if necessary, to meet redemptions.
Technology and Software Credit Exposure by Asset Class ¹³
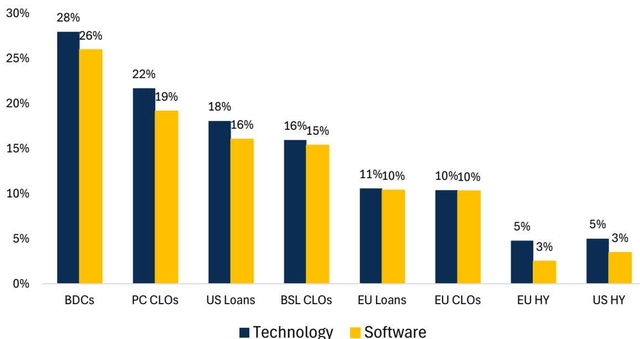
If the performance graph for BDCs shows the market’s discomfort with private credit as a structure, the chart above points to one reason for that discomfort. BDCs have meaningfully greater exposure to technology and software credits than the broader U.S. loan market and substantially more than the highly diversified high yield bond market.O That is not a trivial detail. It helps explain why investors have grown uneasy about the asset class at the same moment that AI is reshaping the way companies operate, hire and spend. In other words, private credit is not just a liquidity story. It is also a sector exposure story.
The concern is not hard to understand. Many software and technology companies built for a world of abundant capital and predictable recurring revenue now face a world in which customers are scrutinizing spending, AI tools are changing product value, and investors are less willing to fund long-duration hopes at short-duration prices. Some businesses will adapt just fine. Some will not. That does not mean every software credit is bad, but it does mean the market’s nervousness is not entirely irrational. When a sector that has long benefited from optimism suddenly has to prove cash flow durability the old-fashioned way, lenders tend to become less romantic.
This is where the lessons from our 4Q 25 letter remain useful. In the direct lending market, defaults have risen more sharpl ythan in the traded high yield and leveraged loan markets, sponsors have increasingly “tapped out,” bad PIK ¹⁴ has become more common, and loan-to-value ratios on troubled credits have moved meaningfully higher.P At the same time, traded high yield and leveraged debt appear to be in relatively better shape than direct lending, even if they are hardly cheap.Q Not that all public markets are safe and not all private markets are dangerous. For all asset classes, when stress rises, structure, documentation, transparency, and real liquidity begin to matter more than the sales pitch.
Mutual Fund Selected Characteristics 3/31/26R
“Meet the New Boss, Same as the Old Boss”
Across energy, artificial intelligence, and private credit, the message is the same even if the markets are different: scarcity of supply, scarcity of capital, and scarcity of liquidity. For investors, that brings us back to the distinction between real risk and mispriced risk . Real risk is the kind that can leave a permanent mark – broken business models, too much leverage, impaired supply, or capital structures that stop working when markets get tight. Mispriced risk is what happens when markets get too comfortable and decide that price, structure, and liquidity no longer matter very much. The problem is that mispriced risk has a way of becoming real risk for the undisciplined, the overly optimistic, or the unwary.
There is another trap as well: sometimes the asset is not the problem — the path is. A problem with a specific credit or fund, or a market dislocation may well be work itself out over time, but panic, redemptions, or a sudden need for cash can turn a temporary markdown into a realized loss. That is why illiquidity, by itself, is not the villain. Uncompensated illiquidity is the villain. Misunderstood illiquidity is the villain. In a world where prompt supply commands a premium, capital is not exactly sitting around bored, and liquidity has a bad habit of disappearing right when people start needing it, the old rules still apply: price matters, structure matters, and discipline matters. “Won’t Get Fooled Again” is not about cynicism. It is about remembering that risk never goes away.
Risk changes price. It does not disappear.
DKS
David Sherman and the CrossingBridge Team
Postscript: We often include a few examples of positions from the quarter to show how our views translate into actual investments. We chose not to do that this time, partly because this letter has already covered a fair amount of ground and partly because, as some of our clients know, brevity has never been my strongest suit. My exceptional team, on the other hand, is often the better choice if you need the short version quickly.
In lieu of our usual examples, we would point readers to our new Principles & Interests series, which we expect to publish several times a year to complement our quarterly letters. The goal is simple: shorter, more focused pieces that highlight specific investments, situations, or market developments and show how we think about them from a practitioner’s point of view – bottom-up, value-oriented, and disciplined. Our first piece, ” EA Bonds – It’s in the Docs ,” was written by Michael De Kler, a Portfolio Manager focused on the CrossingBridge Ultra-Short Duration Fund (CBUDX), RiverPark Short Term High Yield Fund (RPHIX), and CrossingBridge Ultra Short Duration ETF (CUSD). It is a good example of the kind of work we hope to share more regularly, with the next piece expected in late May or early-to-mid June. These pieces will usually be written by members of the CrossingBridge team so that our investors and readers can become more familiar with the people behind the work, not just the person who usually gets blamed for the length of the quarterly letter.
References
A Bloomberg
B Bloomberg
C $133 vs. $99. What is the Real Price for a Barrel of Oil? , Wall Street Journal, April 14, 2026
D Bloomberg
E James D. Hamilton, “Causes and Consequences of the Oil Shock of 2007-08,” Brookings Papers on Economic Activity 40, no. 1 (Spring 2009): 215-83; Olivier J. Blanchard and Jordi Galí, “The Macroeconomic Effects of Oil Shocks: Why Are the 2000s So Different from the 1970s?” NBER Working Paper no. 13368 (Cambridge, MA: National Bureau of Economic Research, 2007); Lutz Kilian, “The Role of Oil Price Shocks in Causing U.S. Recessions,” International Finance Discussion Papers no. 1114 (Washington, DC: Board of Governors of the Federal Reserve System, 2014). Together, these studies suggest that oil shocks have tended to be more damaging when associated with supply disruption or geopolitical stress than when driven principally by strong demand, and that the effects depend importantly on the surrounding inflation and financial backdrop
F Bloomberg. Prices from 1/2/26 to 3/31/26 for polyethylene (Bloomberg: <POL1 Comdty>), urea (Bloomberg: <GCFPURGB Index>), and Asphalt and Other Petroleum and Coal Products (Bloomberg: <PPIJFHAD Index>)
G We are no longer in the 1970s , Bank of America, April 13, 2026
H Ibid.
I American Automobile Association
J Oil Market Report , International Energy Agency, March 12, 2026
K World Population Review – Helium Production by Country 2026
L Model Evaluation and Threat Research (METR)
M Bloomberg and Software’s Boogeymen Return – Unpacking Anthropic & OpenAI’s Supercycle , Jefferies, April 2026. Statistics for Amazon and Alphabet (aka Google) are based on full year results and year-end enterprise values beginning in the year of their initial public offerings (1997 for Amazon and 2004 for Alphabet). Valuation for OpenAI and Anthropic are per Jefferies.
N Bloomberg. Reflects the performance from 1/3/23 to 3/31/26 for the iShares iBoxx USD Investment Grade Corporate Bond ETF (LQD), the ICE BofA US High Yield Index, and the VanEck BDC Income ETF (BIZD).
O Ibid.
P BofA Global Research and Lincoln Senior Debt Index Q3 2025, Lincoln International LLC, September 30, 2020 through September 30, 2025; The Lincoln Private Market Index Records Another Quarter of Growth in Q2 , Lincoln International LLC, August 2025; and J.P. Morgan, 2026 High Yield Bond and Leveraged Loan Outlook , November 25, 2025. Cited based on the observation that defaults in direct lending have risen more sharply than in traded high yield and leveraged loans, that “bad PIK” debt has become more prevalent, that loan-to-value ratios on troubled direct loans have increased materially, and that traded high yield and leveraged loan defaults are expected to remain closer to historical norms than stress levels currently seen in direct lending.
Q Ibid.
R Dry powder is defined as the sum of cash, cash equivalents, pre-merger SPACs, and maturities of 90 days or less.
References
- Won’t Get Fooled Again, a song written by guitarist and primary songwriter for the English rock band, The Who, was released in June 1971 and appeared on the band’s studio album, Who’s Next , in August 1971. Arguably one of the band’s best-known songs (and my favorite), it is a warning that politicians and revolutionaries regularly claim that they are agents of change, but they rarely are.
- Q4 2025 Commentary – Tap
- We created this ranking using a proprietary method via Claude (artificial intelligence) employing a composite index, normalized to a 0-10 scale, of the magnitude of economic, policy and market factors across 200 years to rank 35 periods of significant disruption. Please see 4Q25 Commentary for more details. Methodology and factors available upon request.
- Shows the differential in the price of Dated Brent Crude vs the ICE Front Month Futures in each of the first eight weeks beginning just before the onset of COVID (2/20/20) and the beginning of the Iran conflict (2/21/26).
- Dated Brent Crude is crude oil that is to be physically delivered within the next 10-30 days. The June 2026 ICE Brent Crude futures are the “front-month” with the contract expiring on April 30, 2026.
- Contango is a condition in the futures market where a commodity’s future price is higher than its spot price.
- Backwardation is a condition in the futures market where a commodity’s spot price is higher than its future price.
- Unconventional strategies, often low-cost, high impact tools such as kamikaze drones, small attack boats, guerilla tactics, and cyber warfare, are employed by weaker combatants against enemies that have military, technological, and financial superiority.
- This is not such a revelation as the Strait of Hormuz has been a critical focal point of empires seeking to control trade. In the 1500s, the Portuguese established a permanent fortress along the Strait and mandated that ships pay for licenses for transit or face seizure or destruction. In the 1800s, the Al Qasimi tribe (in what is now the UAE) dominated the northern part of the Strait, using fast dhows to harass and seize European merchant vessels.
- The METR LLM Time Horizon shows task duration, measured by human expert completion time, over which an AI agent is predicted to succeed 50% of the time based on the performance of publicly available AI agents over a hundred diverse software tasks. The rise in task duration implies the AI’s capability to accurately complete increasingly complex tasks.
- Virginia recently enacted a new electricity rate class for large-scale customers. The Maine legislature has passed a law banning development of data centers.
- Our Director of Research, Bruce Falbaum, began his career in 1988 with an eight-year stint in the Private Placement Group of Prudential Insurance Company.
- Illustrates exposure by asset class. Reflects source classification as of the report date.
- Pay-in-kind (PIK) refers to the ability of an issuer to pay interest by issuing additional debt in lieu of paying cash. “Bad PIK” is the more troubling variant – debt that originally required cash interest payments but has since been amended to allow payment-in-kind because the borrower’s cash flow has deteriorated. It is a distress signal dressed up as an amendment.
- A: Bloomberg
- B: Bloomberg
- C: $133 vs. $99. What is the Real Price for a Barrel of Oil? , Wall Street Journal, April 14, 2026
- D: Bloomberg
- E: James D. Hamilton, “Causes and Consequences of the Oil Shock of 2007-08,” Brookings Papers on Economic Activity (2009); studies suggest oil shocks are most damaging when associated with supply disruption.
- F: Bloomberg. Prices for polyethylene, urea, and asphalt.
- G: Bank of America, April 13, 2026
- H: Ibid.
- I: American Automobile Association
- J: Oil Market Report , International Energy Agency, March 12, 2026
- K: World Population Review – Helium Production by Country 2026
- L: Model Evaluation and Threat Research (METR)
- M: Bloomberg and Jefferies, April 2026. Statistics for Amazon and Alphabet; valuations for OpenAI and Anthropic.
- N: Bloomberg. Performance from 1/3/23 to 3/31/26 for LQD, ICE BofA US High Yield Index, and BIZD.
- O: Ibid.
- P: BofA Global Research and Lincoln Senior Debt Index; J.P. Morgan, 2026 High Yield Bond and Leveraged Loan Outlook.
- Q: Ibid.
- R: Dry powder is defined as the sum of cash, cash equivalents, pre-merger SPACs, and maturities of 90 days or less.
Original Post
Editor’s Note: The summary bullets for this article were chosen by Seeking Alpha editors.
Read the full article here