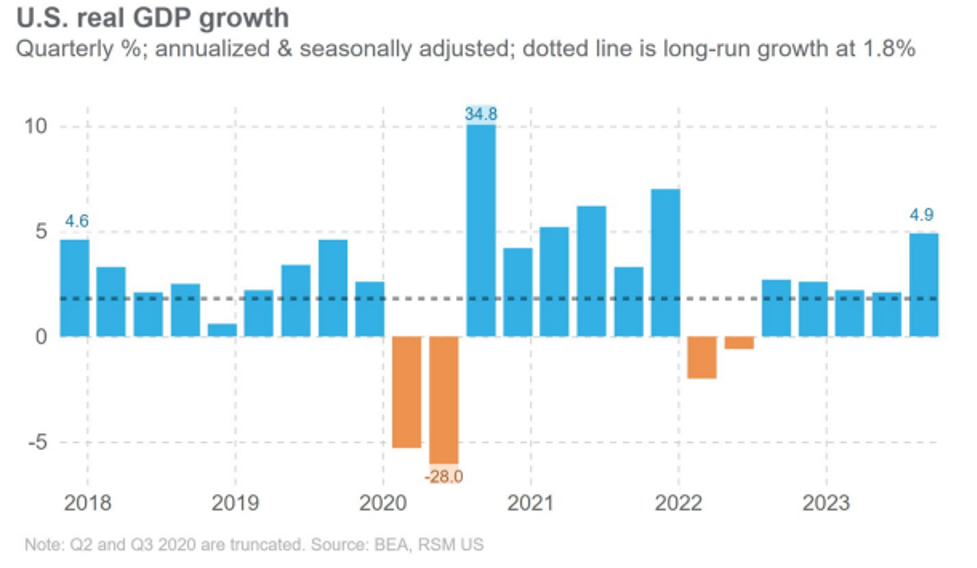
The economic story of the week was the “hot” 4.9% GDP print. The chart shows this in relationship to the recent past, with the dotted line showing the long-run 1.8% growth rate of the economy. The 4.9% is an annualized number, so the actual growth from Q2 was just under 1.5%, and the year/tear growth was 2.9%.
In his daily missive to subscribers on Friday (October 27), Economist David Rosenberg observed that immediately after the “hot” GDP release on Thursday morning, bonds rallied (prices rose) while stock prices fell. Normally, if the economy is expected to continue to be strong, the opposite should occur, as strong growth should continue a “hawkish” Fed stance, and, perhaps, even cause them to raise rates. Apparently, market players aren’t buying into either the “strong economy” or the “soft-landing” scenarios. Equities have been falling of late, down -10% from their end of July peaks.
Back to GDP, the table shows the contribution by category.
Consumption Growth
In our last blog, we discussed the role of “excess savings” in those blowout consumption numbers and noted that with the savings rate more or less back to normal after a big decline this past quarter, and credit card balances at all-time highs, another such quarter of consumption growth is highly unlikely (note on the left-hand chart the rather large down move in the savings rate in the last quarter).
Inventories, which accounted for 1.3 pct. points of the 4.9, are quite fickle. Any sign of a slowdown in consumption leads to inventory liquidation, i.e., items “on sale.” This bodes ill for the retailer as holiday shopping season commences. For this discussion, it is more likely that in next quarter’s equivalent table to the one above, inventories will be a subtraction from GDP.
Note also that government spending added +0.8 pct. points. It is unlikely that this Congress will allow an even greater budget deficit than the one that existed last quarter. So, it is unlikely that we will see GDP expansion from this source; in fact, the opposite is likely.
In addition, because the consumer has tapped out their savings, and, because many consumers are now up against or approaching their credit card limits, these sources of GDP won’t be available in Q4 (and likely not in Q1 and Q2 of 2024). Finally, rejection rates for new credit cards and rejection rates for increased limits are at or near all-time highs (see above charts). So, it isn’t likely that credit card spending will be a source of rising consumption in the near term.
Housing
The high interest rate scenario has clearly affected housing. Mortgage applications have been falling and are now near a three-decade low, off -18% from year earlier levels. Pending sales of existing homes did rise +1.1% in September, but that barely dented the -7.1% print from August. So, no, not anywhere near the readings from this past spring and summer. New home sales, at 12.3% growth in September over August, looks encouraging. But, to us, this looks more like home builders doing inventory liquidation, as interest costs to carry such inventory have skyrocketed. To clear inventory, builders are giving price concessions. The median sales price has been falling (-3.3% in September vs. August) and is down -12.3% from year ago levels.
The Fed
The next set of Fed meetings are scheduled for the October 31-November 1. Markets have placed odds of a rate hike at 10%. Normally, such odds need to be at 50% or more for there to be any real chance of a hike. Nevertheless, this Fed is unpredictable (thus the 10% chance). Our view is that they will continue to “pause” but also continue the “hawkish” rhetoric (“higher for longer” etc.). Afterall, they do not want the bond markets to move rates down (in their estimation: “prematurely”). It is a game with the markets that the Fed created when they became “transparent” in 2012; now, besides making monetary policy, they must also play the role of a “maestro,” making sure the players (markets) are in sync.
It remains our view that a Recession is imminent, and that the Fed should “pivot” now (begin to lower rates). There is a 0% chance of this at the upcoming meeting and for the one scheduled for December. As we have commented in our blogs over the last 6 months or more, the leading indicators are signaling Recession. This chart shows the tight correlation between them and GDP.
This particular Fed, however, appears to be looking at lagging and coincident economic indicators. For example, the latest “hot” GDP reading may come into play in their decision making (despite good reasons like those above as to why such economic growth won’t continue).
Other telling signs that a Recession is near include rising delinquency rates. The charts show that both credit card and auto loan delinquencies are approaching or are above their pandemic highs.
Manufacturing – in Recession
Every survey of manufacturers of late tells us that sector is already in Recession. The latest three such surveys (Philly Fed, Richmond Fed, and Kansas City Fed) continued the saga. The Philly Fed index was -20.3 in October, in contraction now for seven of the last eight months. New orders, sales and inventories were negative, and while prices paid were up, prices received were flat. This implies an oncoming margin squeeze.
The Richmond Fed Business Activity Composite fell to -15 in October from -5 in September. The only good news here is that prices received fell for the 10th month in a row; again, implying a profit margin squeeze, but also signaling that inflation is becoming dormant.
The Kansas City Fed Manufacturing Survey also showed weakness at a reading of -8, negative now for 13 months in a row. Like the other Fed surveys, this one showed negative readings for new orders, shipments, production, employment, delivery times, and backlogs. And, while prices received were flat, prices paid actually fell, the first time this has happened since May 2020.
Inflation
As noted above, the news on the inflation front continues to be positive. While there was no major inflation news this week, we continue with our view that inflation has been beaten. As we have detailed in past blogs, the CPI is biased by the use of lagging rental data (35 % weight) of up to a year. Rosenberg Research has calculated that if one were to use a current index, like that of Apartment List, today’s CPI headline rate of inflation would be at or below 1%. As a result, we are confident that, going forward, the monthly CPI headline numbers will continue to show progress on inflation.
In addition, for those readers who subscribe to Milton Friedman’s theory that inflation is a monetary phenomenon, M2, for the first time in its history, has turned negative on a year over year basis. Driving this is the rapid fall in commercial bank lending and the Fed’s Quantitative Tightening (selling bonds from its portfolio) policy. From Econ 101, growing bank lending expands the money supply; and when bank credit turns negative, so does the growth of the money supply. In the end, it appears that the tide on inflation has turned.
Final Thoughts
The financial markets look to have caught wind of something sinister. The 10-year T-Note yield, after displaying high volatility a week ago, calmed down somewhat this past week. The 10-Yr T-Note closed under 4.85% after flirting with 5% for much of the past two weeks. The S&P 500 is now off -10.1% from its end of July peak and Nasdaq and the Dow Jones are also off -11.9% and -9.0% respectively. And it isn’t any wonder: 1) The markets suspect a Recession is a strong possibility, the leading indicators and the manufacturing polls tell them that; and 2) the Q3 quarterly reports from major companies (tech being the exception), are downbeat.
(Joshua Barone and Eugene Hoover contributed to this blog)
Read the full article here


