Investment Thesis
On Tuesday, I reviewed the Vanguard Small Cap Value ETF (VIOV) and concluded that due to weak profitability metrics, it was not the best choice for investors looking to diversify by size. Today, I want to discuss the Avantis U.S. Small Cap Value ETF (NYSEARCA:AVUV), an actively managed and substantially stronger choice fundamentally. As I will highlight below, AVUV has nearly twice the ROE as the market-cap-weighted VIOV and a sector-adjusted profit score near the top of its category. Results are good, too, with AVUV’s four-year total returns miles ahead of 16/17 other small-cap value options. Therefore, I’ve reiterated my “buy” rating on AVUV but still encourage long-term investors to prioritize profitability, which may mean exiting small-cap value ETFs altogether.
AVUV Overview
Strategy Discussion
According to its prospectus, AVUV uses a proprietary approach to select small-cap stocks with high profitability ratios trading at low valuations. Examples of the screens used include a company’s reported and estimated book values and cash flow from operations, with “profitability” defined as adjusted cash from operations to book value. The principal value characteristic is adjusted book/price, and managers also consider past performance, liquidity, float, tax, governance, and overall diversification when designing the fund.
AVUV managers also operate with high conviction, as evidenced by a consistently low portfolio turnover rate of just 7% for the year ending August 31, 2023. As an analyst, this gives me confidence the holdings won’t change dramatically, and the factors I will emphasize shortly accurately reflect the managers’ styles.
Avantis
Fund Basics and Alternatives
The following Seeking Alpha table highlights some of AVUV’s statistics, like its 0.25% expense ratio and $6.6 billion in assets under management. I also included the Vanguard Small Cap 600 Value ETF (VIOV), the iShares Russell 2000 Value ETF (IWN), and the Dimensional U.S. Targeted Value ETF (DFAT) as alternatives. VIOV and IWN follow a market-cap-weighting scheme, while DFAT is actively managed like AVUV.
Seeking Alpha
With a track record of just over four years, it’s impressive to see AVUV’s AUM climb almost as high as IWN and DFAT, which launched more than two decades ago. Its expense ratio is also attractive, and I firmly believe that small-cap value is one category where you pay for what you get. For example, IWN’s long-term returns are disappointing, and not coincidentally, it has a terrible profit score. AVUV’s focus on profitability is the correct approach, but the main question is how much it’s emphasized. We’ll see shortly, but first, let’s look at its track record.
Performance
The following performance table highlights one-to-ten-year total returns for AVUV and 17 small-cap value peers, including the three above.
The Sunday Investor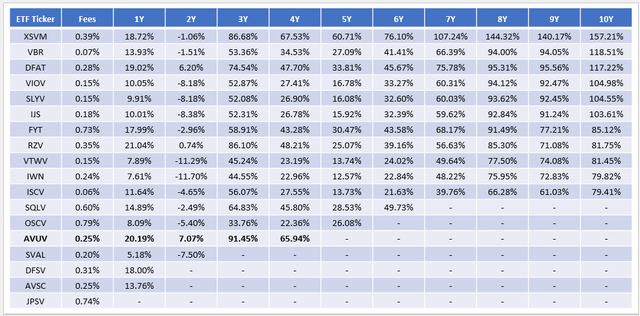
The list is sorted by ten-year returns through September 2023, a track record unfortunately not held by AVUV. However, we can see that its 65.94% four-year total returns were second best, slightly behind the Invesco S&P SmallCap Value With Momentum ETF (XSVM) but 17.73% ahead of the third-place Invesco S&P SmallCap 600® Pure Value ETF (RZV). AVUV’s three-year returns rank #1, with DFAT’s 74.54% return in the mix at #4.
Notably, VIOV, SLYV, and IJS, which track the market-cap-weighted S&P SmallCap 600 Index, have lagged AVUV by 39% over the last four years. The same is true for ISCV, a small-cap value ETF based on a market-cap-weighted Morningstar Index. These examples are why it’s worthwhile considering multi-factor ETFs like AVUV, even if their fees are slightly higher.
One downside to small-cap value ETFs is they tend to be more volatile, even compared to their small-cap growth options. However, AVUV’s periodic return-to-risk ratios, which measure its annualized returns divided by its annualized standard deviation, were better than VIOV, IWN, and DFAT.
The Sunday Investor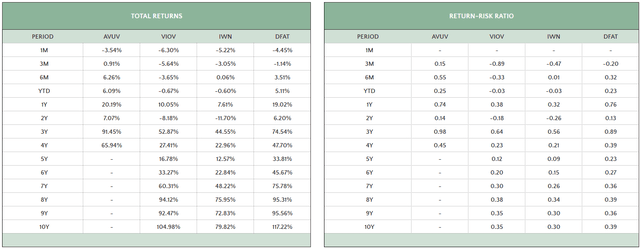
AVUV Analysis
Sector Exposures, Top Holdings, and Key Sub-Industries
The following table highlights sector exposure differences between AVUV, VIOV, IWN, and DFAT.
Morningstar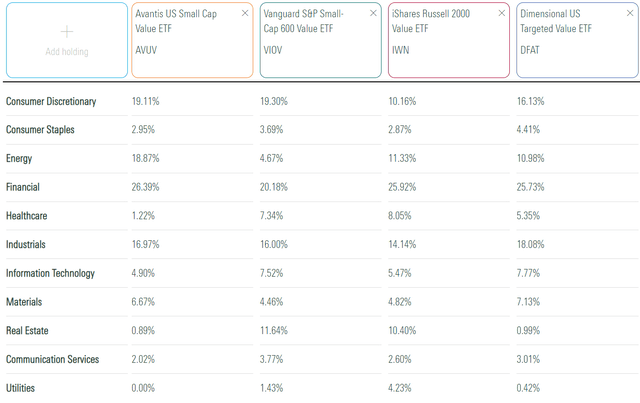
AVUV stands out for its 18.87% exposure to Energy stocks, which I find a bit excessive. However, it reflects one narrative floating around regarding the direction of oil prices should the Middle East conflict escalate further. As noted in my review of VIOV, the World Bank estimates a 21-35% initial oil price spike to $101-$121 per barrel in a “medium disruption” scenario where supply drops by 3-5 million barrels per day. At the same time, the Bank’s baseline forecast is an average $81 per barrel price in 2024 due to weak global growth. It’s this constant demand and supply tug-of-war that makes predicting oil prices so challenging, but evidently, AVUV fund managers see significant upside potential.
AVUV also has 26.39% exposure to Financials but only 0.89% to Real Estate, a substantial deviation from VIOV and IWN. This indicates nearly all of AVUV’s distributions are qualified for tax purposes. For the year ending August 31, 2023, I calculated the figure to be 99.91% based on the latest annual report.
Finally, like most small-cap value ETFs, AVUV is well-diversified. The top ten holdings comprise only 8.25% and are led by Ryder System (R), Boise Cascade (BCC), and Mueller Industries (MLI).
Avantis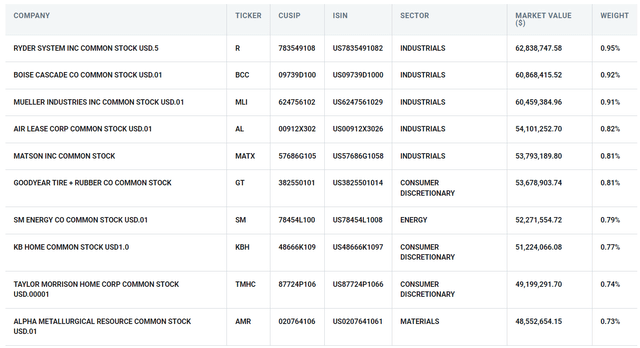
More helpful information is that AVUV has 15.98% exposure to Regional Banks, a red flag for some investors. However, its selections appear to be in better shape. For example, VIOV’s Regional Bank stocks are down by 29.14% in 2023 and have an 8.34% trailing ROE, while AVUV’s are down by 19.87% and have a 13.38% trailing ROE. These changes make AVUV a better choice than VIOV but are only revealed through fundamental analysis. With that said, let’s look at AVUV’s other key sub-industries in more detail next.
AVUV Fundamentals By Sub-Industry
The following table highlights selected fundamental metrics for AVUV’s top 25 sub-industries, totaling 72.89% of the portfolio.
The Sunday Investor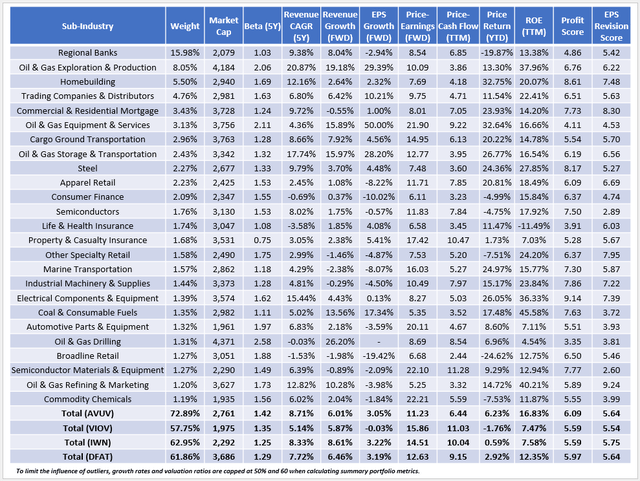
I want to emphasize AVUV’s superior profit score of 6.09/10, which I derived using individual Seeking Alpha Factor Grades. It’s backed by a 16.83% weighted average trailing return on equity, more than double what VIOV and IWN feature. DFAT’s ROE is also solid at 12.35%, more evidence that with small-caps, profitability is enhanced with active management. The opposite is often true for large-cap ETFs. For example, the SPDR S&P 500 ETF (SPY) has a 9.39/10 profit score, but the average profit score for the 25 large-cap blend ETFs following an active strategy is only 9.17/10.
AVUV has 15.98% allocated to Regional Banks, but as I mentioned earlier, it’s the quality of its selection that matters. In May, I noted how the ALPS O’Shares U.S. Small Cap Quality Dividend ETF (OUSM) avoided the Regional Bank crisis entirely by relying on a ROA screen for Financials. In AVUV’s case, all but one of its 193 Regional Bank holdings have a positive ROA. In total, 90% of constituents have a positive ROA compared to 78%, 77%, and 86% for VIOV, IWN, and DFAT. Again, it’s the actively managed ETFs that emphasize profitability better. The takeaway is that small-cap strategies need a profitability screen, while it may be redundant with market-cap-weighted large-cap ETFs.
As a value ETF, high growth isn’t the focus. However, I like how AVUV has some growth potential, as indicated by its 3.05% estimated earnings per share growth rate. IWN and DFAT are similar, but AVUV trades at the lowest valuation at 11.23x forward earnings. Its 1.42 five-year beta is the highest of the four, but AVUV’s superior quality should lead to less downside risk. It wasn’t the case in Q1 2020 when AVUV lagged behind IWN by 6.59%. Still, as the graph below highlights, both ETFs took nine months to recover fully, and AVUV’s drawdowns were less after that.
Portfolio Visualizer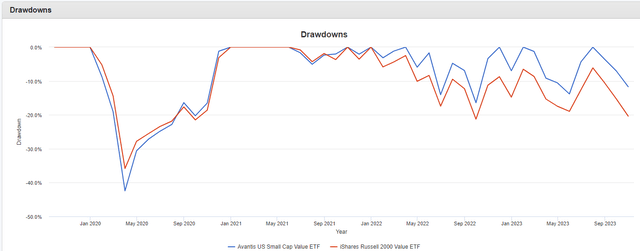
Investment Recommendation
Superior profitability is why small-cap value ETF investors should choose AVUV over market-cap-weighted alternatives. For a slightly higher expense ratio, investors receive a stronger portfolio with a better profit score and an above-average combination of growth and valuation. AVUV is also a low-turnover ETF, which gives me confidence that the factors emphasized today will also be highlighted moving forward. Finally, AVUV’s four-year track record, which is second-best among 17 of its peers, indicates AVUV’s approach has merit. A valid concern is whether the fund’s 6.09/10 profit score is sufficient, but for the small-cap value category, it’s a clear improvement. Therefore, I’ve assigned a “buy” rating to AVUV, and I look forward to discussing this and other alternatives in the comments below.
Read the full article here

