Capital Group Core Equity ETF (NYSEARCA:CGUS) is an actively managed fund with a strategy that, according to its website, mixes “growth and income to potentially provide a smoother ride.” CGUS represents a fairly rare example of an ETF that I have rated a Buy. Back in February 2024, there were two key reasons for that, namely its impressive past performance and the balance of style factors I found perfectly sound for the dominating market narrative and, hence, capable of securing more gains. And today, I would like to discuss why this rating should be maintained.
What are the integral parts of CGUS strategy?
As described in the prospectus, CGUS is managed actively, favoring
…common stocks of companies that the investment adviser believes demonstrate the potential for appreciation and/or dividends.
Though U.S. focused, the ETF
… may invest up to 15% of its assets, at the time of purchase, outside the United States. The fund is designed for investors seeking both capital appreciation and income.
The following is said about the securities selection:
The fund relies on the professional judgment of its investment adviser to make decisions about the fund’s portfolio investments. The basic investment philosophy of the investment adviser is to seek to invest in attractively valued companies that, in its opinion, represent good, long-term investment opportunities. Securities may be sold when the investment adviser believes that they no longer represent relatively attractive investment opportunities.
CGUS performance: an outperformer proves its reputation
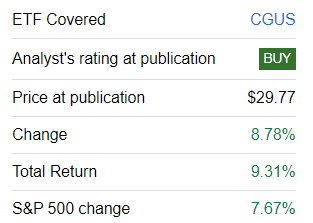
First, since my previous note published on February 9, CGUS has outpaced the S&P 500 index.
Seeking Alpha
Looking a bit closer at monthly performance, we see that CGUS has beaten the iShares Core S&P 500 ETF (IVV) in three out of 8 full months. Thanks to impressive performance in July (1.49% outperformance), it was ahead of the S&P 500 ETF by 27 bps in January-August.
Second, during the March 2022-August 2024 period (CGUS was launched in February 2022), CGUS beat IVV by 1.37% (annualized return), also delivering lower volatility and, as a consequence, stronger risk-adjusted returns.
| Metric | CGUS | IVV |
| Start Balance | $10,000 | $10,000 |
| End Balance | $13,833 | $13,420 |
| CAGR | 13.86% | 12.49% |
| Standard Deviation | 16.84% | 18.14% |
| Best Year | 27.71% | 26.32% |
| Worst Year | -9.49% | -11.02% |
| Maximum Drawdown | -20.37% | -20.28% |
| Sharpe Ratio | 0.62 | 0.52 |
| Sortino Ratio | 0.93 | 0.78 |
| Benchmark Correlation | 0.99 | 1 |
| Upside Capture | 95.97% | 100% |
| Downside Capture | 89.95% | 100% |
Data from Portfolio Visualizer. IVV was used as a benchmark
CGUS current factor mix: mostly robust, minor disadvantages over IVV
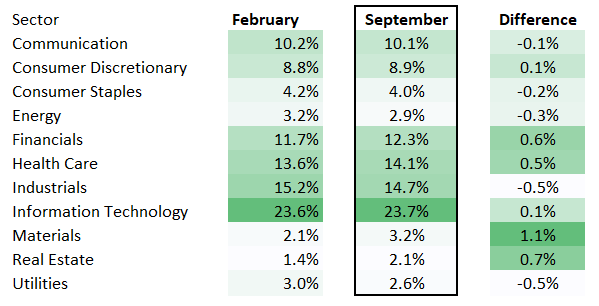
As of September 4, there were 91 equities in the CGUS portfolio, with the key sector being information technology (23.7%), followed by industrials (14.7%) and health care (14.1%). As mentioned above, the fund can venture outside of the U.S. in pursuit of promising stocks, and the current version of the portfolio does have some overseas exposure. More specifically, in the holdings dataset from the ETF’s website, I found 15 stocks (11.7% of the net assets) with a country code other than ‘US.’ Most of them are Canadian companies (4 stocks, 3.3%, including Canadian Natural Resources (CNQ)), but there are also Swiss, French, British, Irish, Japanese, Korean, and Dutch stocks. With a LR0008862868 ISIN, Royal Caribbean Cruises (RCL) is also on that list; the reason for that can be found on page 2 of its Form 10-K:
…the current parent corporation, Royal Caribbean Cruises Ltd., was incorporated on July 23, 1985 in the Republic of Liberia under the Business Corporation Act of Liberia.
How significantly has the CGUS portfolio changed since February? Its basket is certainly not static, and it does add and remove stocks from time to time. For example, as I was working on this note for a few days, I noticed that the ETF added Sanofi (SNY) at some point between September 2 and September 4. And since February, more than 20% of its portfolio has been replaced, and the count of equities went from 120 to just 91. The three key deletions are shown below:
| Stock | Weight as of February 7 |
| Hilton Worldwide (HLT) | 0.78% |
| ConocoPhillips (COP) | 0.75% |
| Northrop Grumman (NOC) | 0.75% |
Data from the ETF
The most significant additions were as follows:
| Stock | Weight as of September 4 |
| Fidelity National Information Services (FIS) | 1.42% |
| Air Products and Chemicals (APD) | 1.31% |
| S&P Global (SPGI) | 0.91% |
Data from the ETF
Despite about a fifth of the basket replaced, CGUS’ sector allocation changed only a little.
Created by the author using data from Seeking Alpha, CGUS, and ITOT
For clarity, preparing the sector analysis tables, I also used data from the iShares Core S&P Total U.S. Stock Market ETF (ITOT).
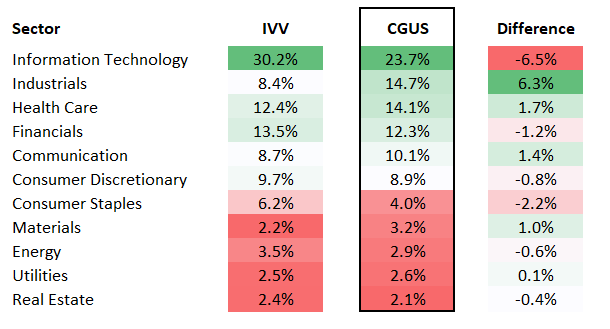
The next table illustrates how CGUS’ sector mix compares to that of IVV. The picture is similar to the one we saw in February. The key takeaway is that CGUS underweights IT and overweights industrials.
Created by the author using data from Seeking Alpha and the ETFs
What has changed in terms of factor story? Let us start with value.
Valuation: some expensiveness to tolerate
Perhaps the first question worth asking here is whether CGUS’ opinion on the Magnificent Six differs from that of the S&P 500 fund. Or on the trillion-dollar league overall, including Apple (AAPL), Amazon (AMZN), Berkshire Hathaway (BRK.B), etc.? In fact, I would say that its stance on these bellwethers is only slightly different, as all seven trillion-dollar companies are present in its portfolio, so it seems the fund is bullish on all of them. However, they still have much smaller weight, 26.6% vs. 30.3% in IVV.
| Metric | CGUS | IVV |
| Market Cap | $803.52 billion | $906.47 billion |
| Adjusted EY | 3.45% | 3.82% |
| P/S | 6.89 | 7.57 |
| EV/EBITDA | 21.73 | 22.47 |
| Quant Valuation B- or higher | 5.22% | 5.93% |
Calculated by the author using data from Seeking Alpha and the ETFs. Financial data as of September 5
Its smaller allocation to the most richly valued companies in the world is one of the reasons why its weighted-average market cap is lower than that of IVV. A bit more comfortable Enterprise Value/EBITDA and Price/Sales are also the consequence of that. However, the adjusted earnings yield is, surprisingly, lower, and exposure to stocks with the Quant Valuation ratings of B- or higher is smaller as well. As a reminder, the adjusted EY was 3.9% as of February 8, so it seems it has retreated on the back of capital appreciation, plus changes in the stock mix have also impacted it. Nevertheless, while I would prefer to see better value characteristics, I see this is an insufficient argument to downgrade the rating.
Growth characteristics
Turning to growth, at first glance, it seems CGUS offers a bit less appealing growth profile. However, upon more attentive inspection, it turns out that it has one significant advantage: it has smaller exposure to companies that are forecast to deliver lower sales and/or earnings per share going forward.
| Metric | CGUS | IVV |
| EPS Fwd | 16.08% | 17.16% |
| Revenue Fwd | 9.74% | 11.51% |
| EBITDA Fwd | 14.78% | 18.60% |
| Quant Growth B- or higher | 45.30% | 43.20% |
| Forecast EPS contraction | 9.9% | 14.73% |
| Forecast revenue contraction | 6.39% | 10.56% |
Calculated by the author using data from Seeking Alpha and the ETFs
Profitability and capital efficiency
On the quality front, it also seems IVV is a bit ahead. However, I would like to emphasize that, precisely like in February, CGUS offers an impressive story as well, as all the metrics below are confidently above the level I consider necessary for large/mega-caps-focused portfolios (i.e., Return on Assets above 10% and adjusted Return on Equity above 20%, etc.).
| Metric | CGUS | IVV |
| ROA | 10.78% | 14.14% |
| Adjusted ROE | 20.17% | 20.20% |
| Net Income Margin | 18.61% | 21.20% |
| Quant Profitability B- or higher | 91.61% | 94.93% |
| Net CFFO-negative companies | 1.6% | 3.2% |
Calculated by the author using data from Seeking Alpha and the ETFs
Apart from that, it has a bit smaller exposure to companies that outspent their net operating cash flows in the last twelve months.
Final thoughts
CGUS represents an active strategy with impressive returns and solid quality. I believe the ETF is on track to deliver yet another alpha year. In January-August, it has already outperformed IVV by 27 bps, and I see no material reason why it should lose its edge even despite differences in fees (3 bps vs. 33 bps).
However, it does not imply risks do not exist. In my previous note, I explained that in case of a market-wide correction (and we are probably watching one in the making as the S&P 500 is down by 1.73% as I am writing this on September 6, likely because of the soft August jobs report), CGUS is also vulnerable. But even here it has an advantage—a meaningfully lower historical downside capture ratio, implying that if IVV goes south, CGUS will fare a bit better. This point is still relevant today.
Read the full article here


