We are excited about 2026. Not just because the author’s favourite sports teams are presently all heading in an upwards direction. More so because the opportunity set for our style and philosophical approach to equity investment is now deeper and wider than for some time, despite market indices flirting with record highs and above normal valuations.
Equity markets have a familiar stench at present. Greed, impatience, hubris. “If it’s not contributing this quarter, it’s no good.” Trustees moving more money to replicate extremely concentrated benchmarks because active management “no longer works.” Increased use of statistical prowess to capture momentum, irrespective of the business or valuation fundamentals of the underlying security. Increasingly aggressive pushes for “capital management” even if such “management” is destructive to long-term stockholders by transferring value to a third party through business unit sale. Opaque private equity AND private credit marks – a failure to often acknowledge weakened credit prospects until it’s too late.
This is not another “AI bubble” screed, just a simple philosophical observation regarding investor psychology – that these factors have driven investors towards what they believe is risk aversion (in fact it’s the reverse) away from areas where real securities mispricing exists.
Performance and net asset value
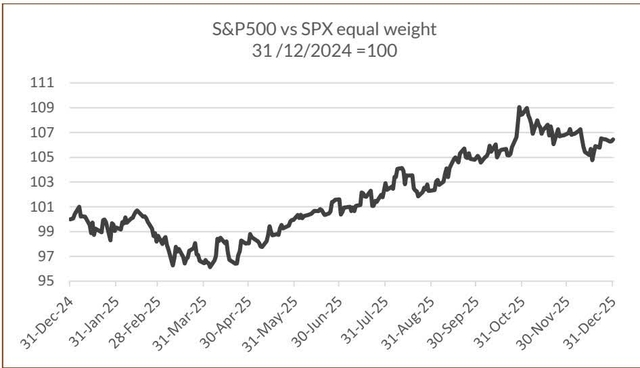
As we noted in our presentation “Bifurcated Markets and the Attractions of Controlled Companies” (21 November 2025) it was only from around 20 June 2025 with the S&P500 then up a mere 1.5% for the 2025 year to date, that the concentrated S&P500 started to outperform its equal weighted counterpart as technology enthusiasm took off. This, of course, has stepped up the top 10 weightings (including all of the Mag 7 stocks) to comprise 39.2% of the S&P500 index. From that point onwards, with smaller companies and controlled companies moving out of favour (for what we believe will be a brief period) the performance of Dynasty Trust – not unexpectedly – rolled off.
2025: A quick recap
Being Australian domiciled, Dynasty Trust operates to an Australian fiscal year ending in June; return fees are accrued during the year but are assessed and paid out at that time. The following calendar year assessment is calculated in Australian dollars, which accentuates the returns from euro-denominated securities as the A$ fell by around 5.5% against the euro over the course of 2025, but reduces the return of US$-denominated stocks as the A$ rose by 6% against the greenback over the year. In overall terms, the change in Australian dollar exchange rates over 2025 cost a mere 11bp in performance; it was however, a larger factor in the second part of the year , having added 1.9% in the seven month period to end-July but detracting 2% from returns in the final five months .
Seven securities added positive contributions of over 0.9% to Dynasty Trust from their dates of acquisition or to date of sale in Australian dollar terms:
Six securities or correlated stocks stripped away over 0.40% from our return over 2024, as follows:
The five major absolute contributors in Australian dollars to December 2025 quarterly return are tabulated below; as a guide only, the individual stock returns are in local currency for the actual period; strength in the Australian dollar over the quarter reduced returns by 67bp:
Dynasty Trust’s top twenty positions as at 31 December 2025 as a percentage of net asset value are:
At quarter end, we held 30 exposures and retained 8.3% net cash weighting after all accruals.
The three-year Anti-Bubble: control is now a dirty word.
We started East 72 Dynasty Trust around three years ago on the back of beneficial past experiences in controlled entities and detailed empirical research to substantiate the thesis that over the long run , controlled public companies benefit from these ownership characteristics. We were also at pains to ensure the benefits of researching and then investing in these types of companies weren’t diluted by extraneous factors such as stock, index or currency hedging which we feel dilutes the skillset we may have in company analysis.
We started at a time when US technology stocks1 had concluded a 33% decline in calendar 2022, largely led by Meta Platforms (META), which fell by three-quarters between September 2021 and November 2022 faced by employee cost blowouts and cynicism regarding its virtual reality strategy. The subsequent capital gain of 129% over three years in NASDAQ100 (NDX) reflected initial underpricing followed by investors/speculators’ perception of the rewards available in AI. There is little question our major mistakes in Dynasty Trust have been errors of omission, not buying Meta in early 2023 (which we had owned in other accounts) and being fleeting investors in Alphabet (GOOG, GOOGL), both of which are controlled entities, and within our universe.
There is a flip-side to the rerating of US technology: the derating of other securities, from a “base” that was already pessimistic.
We recently attended an online conference of European holding and investment companies. There was a striking diversity of capital Management strategies (“we are very reluctant to buy back our shares”)2 to investors trying to time the next €1billion/5% tender offer3 to “rolling optimised buybacks”4. If we track back three years, a cross-section of these companies and some controlled UK investment trusts has sharply under-performed global indices, with an average share price gain of around 16% in capital terms, and NAV gain (unadjusted for dividends paid) of just over 16%. As a consequence, the average discount to an approximation of NAV, has moved up slightly from 30% to 30.6% over the period. As a group, these companies have been extraordinarily poor investments because NAV growth has been utterly pedestrian, averaging 16.5% (so a mere 5.2% per annum) over three years . But the better performed companies growing NAV in the sample have seen their discounts widen appreciably: D’leteren, Exor, Hansa Investment and HAL Trust. (HAL’s value has increased far more than stated NAV due to Boskalis).
This strange phenomenon results in some of these better performed companies trade at some of the higher discounts to NAV within the cohort group. If we put Bolloré to one side, given the particular and peculiar circumstances it faces, all but one (HAL Trust) of the other four securities we own in the table above have ongoing backbacks in place and so are effectively buying Euros or ponds for fifty cents/pence.
These types of quality securities trading at such discounts represent the obvious extreme of the equity market bifurcation apparent since June 2025 between technology counters – despite recent abatement of gains – and other non-precious metal sectors of global markets.
Our assessment doesn’t mean we are building a portfolio of European holdcos many of which are value traps. However, even the worst offenders of capital management – which usually goes hand in hand with poor capital allocation and investment – are unhappily cognisant of a cyclical high in these discount metrics.
In our view, the high pricing of privately held technology companies has acted as a discount widener for many of these Europeans who run portfolios of either directly invested private businesses (Sofina, Wendel, Eurazeo) or provide access to the funds run by the US titans of the private equity industry. Investors are – not unreasonably – asking, in light of opacity and moderate disclosure of these funds and their “marks” as to WHAT you are actually buying at a 54% discount. It’s why we have favoured Exor despite/because of the recent downturn in Ferrari (RACE) shares, given the strong see-through publicly listed element of over 85% of the portfolio, allied to strong capital management. We acknowledge Exor need to improve some of the portfolio allocations in future years (see QR#11).
Some of the discounts to NAV/intrinsic value that we now observe are not just hefty but rather more prevalent than might be expected. Investors just seem willing to ignore them on the basis that “it’s always been this way” (it hasn’t) or “they are serial underperformers” (looking only at short term history). Our favourite to illustrate the point – detailed below – is a company having now arrived at the culmination of a strategy commenced 70 years ago in the 1950’s by an obscure Jewish émigré from Hamburg to London, an astute player in trading companies, asset plays and shell transactions. The end game company now trades at a discount of 44% to NAV, nearly 68% on a pro-forma cash adjusted basis, has started a buyback program and has a sound track record of investment. But in common with other structures, at present, where there is a controlling shareholder, investors seem petrified the controller won’t manage capital and has ulterior motives. That flies in the face of the evidence we assembled to provide the very basis of Dynasty Trust.
Aside from Hansa, we revisit two previously profiled exposures – D’Ieteren Group and Avation PLC .
Hansa Investment Company: 70-year merger end-game gives flexibility at 44% discount to NAV
The recent transaction whereby Hansa has acquired Ocean Wilson Holdings is the culmination of amalgamating various interests of the Salomon family which began to be accumulated in the 1950’s. Walter (later Sir Walter) Salomon was a Jewish émigré who left Germany in 1938, being pursued by the Gestapo and established himself in London as a small scale banking business (Walter Salomon and Co). He operated as an unincorporated private banker with something of an expertise in spotting undervalued public businesses.
In 1950, Salomon pursued an opportunity to acquire the export subsidiary of Rea Brothers5 , a merchant bank originally established from the proceeds of the sale of a shipping business in 1919, used to manage family investments of the successors of the Rea family. The main protagonist died in 1948 and Rea Brothers was maintained by its erstwhile company secretary.
Rather than take up the export subsidiary, Salomon successfully sought to effect a reverse takeover of the merchant bank and duly did so in June 1950. Also in 1950, Salomon acquired control of a listed shell company, Alto Parana6, a former Brazilian land holder established in 1910, with a London Stock Exchange quotation. This shell was renamed “Scottish and Mercantile Limited” (“S&M”) and used as the vehicle for a cash return from Burntisland Shipbuilding Company.
This interest in other trading type companies yielded other significant or controlling positions, most notably in Ocean Wilsons Holdings, quoted in London, with shipping agencies and tugs in Brazil, where S&M took a 58% significant holding in 1958. The stake was held on behalf of numerous clients, including S&M and the Salomon family itself eventually consolidating into two parcels: 26.4% held by Hansa and 23.6% held by William Salomon and the Townsend family (represented by Salomon’s sister). This became an important basis for the eventual merger of Hansa and Ocean Wilson in late 2025.
Rea Brothers publicly listed in 1960, but in parallel developments in the late 1980’s and early 1990’s, Salomon’s son, William was building an asset management business based around investment trusts – Finsbury Asset Management7 . Finsbury took over the management of S&M – controlled privately by the Salomon family, with Walter having died in 1987 – and changed its name to Finsbury Trust in 1992. In 1995, Rea Brothers acquired Finsbury Asset Management, four years prior to Rea’s own acquisition by Close Brothers, another quoted merchant bank in 1999.
Finsbury Trust stood apart from the other Finsbury Asset Management vehicles investing in a “portfolio of special situations where its holdings may constitute a significant proportion of the equity of companies concerned”8. With Finsbury Trust effectively privately controlled, an inevitable separation from Close Brothers took place and in September 2001, the trust changed its name to Hansa Trust and management was taken over by Hansa Capital Limited. From April 2014 onwards, Hansa changed its investment management philosophy to accentuate regional funds and place money into external managed products, notably US based equity managers, with regional funds, thematic funds and diversifying assets, and gradually divested its direct UK equity holdings – except for Ocean Wilsons. In 2019, the company redomiciled to Bermuda, concerned over the UK political situation, and changed its name to Hansa Investment Company.
In Brazil, Ocean Wilsons (Ocean) built up a series of marine (container terminals, towage) and logistics related businesses and spun these out into a separately listed Brazil company listed in Sao Paulo, Wilson Sons SA, of which it retained 57% of the capital. Ocean Wilsons cash flow from the spin and dividends was retained and invested in a similar manner to Hansa. This created a significant “triple discount” within Hansa since Wilson Sons had to be deconsolidated from Ocean Wilson, and the Ocean investment portfolio separately categorised.
Finally in October 2024, Ocean announced an agreement to sell the stake in Wilson Sons to SAS Shipping, a unit of MSC, the Aponte family shipping business for the equivalent of US$768million (gross) or ~US$625million net of Brazilian tax. The transaction completed in June 2025, and Ocean Wilson undertook a tender offer for 20% of its shares, though Hansa did not participate.
Rather than distribute the remaining cash to shareholders, Ocean reached an agreed merger deal with Hansa, which was unsuccessfully challenged in the Bermudan courts, where Ocean is domiciled. We also disagreed, not with the tenor of the deal, but the fact that cash was priced equivalently to financial assets, when equity markets plainly did not see relative values in that way. Ocean’s court success paved the way for the December 2025 merger to duly proceed, giving Hansa access to a cash pile of £340million – and leaving them with a pro-forma cash exposure of ~35% of NAV.
In our view, 44% discount to NAV is excessive.
Until the merger with Ocean, Hansa’s NAV had returned 38.8% cumulative plus ~1%pa dividends for the period from 31 December 2022 to 9 December 2025 – below global indices – but in the higher reaches of the table on page 4. This was despite the drag of Ocean – making up over 20% of net assets for all the period, and the diversified nature of the portfolio. The merger of the two – given that Ocean itself perennially traded at a large discount to NAV – provides a significant one-off boost of some £0.70 (~17%) per share despite the scrip-based merger. Hansa shares have not priced this uplift at all, nor:
- The significant flexibility for capital management afforded by taking full control of Ocean’s cash pile;
- The reduced risk premium from the divestment of Brazilian assets, in favour of a more conventional portfolio;
- Far greater effective exposure – in time – to listed assets, albeit on a see-through basis.
On a pro-forma basis, equity fund or direct equity assets make up ~46% of NAV, cash ~35% and the residue in unidentified other funds with only 3% being private equity investments. We caution that this composition may have changed significantly when the first new investment update is released in January 2026 depending upon the manager’s disposition to put the Ocean Wilson cash to work.
Disclosed NAV at 31 December 2025 is £4.89 giving Hansa just on a £1billion portfolio; the shares at ~£2.73 trade at a 44% discount. However, adjusting for pro-forma cash, equivalent to £1.70/share effectively means on an ex-cash basis, investors are likely accessing £3.19 of investments for £1.03: a near 68% discount.
Most encouragingly, Hansa commenced repurchasing shares on-market the day after the Ocean merger was completed; NAV accretion is significant with every 1,000,000 shares (~0.5% of total capital) adding 0.22% in NAV accretion. Hansa had facilitated this level of equity retirement between 10 December 2025 and the year end. So despite this quiet capital management initiative, equity investors appear to regard control within Hansa to be pernicious in the extreme, and that the family control is a negative. We disagree. In common with many of our other holdings (eg E-L Financial) Hansa are extremely parsimonious with new share issuance; other than for the merger with Ocean, we can find no record of Hansa issuing new equity in over 46years, other than through share splits – a very desirable and unacknowledged attribute.
D’leteren: Gearing, opacity and reported profit decline obscuring value of Belron
As a reminder, D’leteren is a Belgian family controlled auto-related holding company with five businesses as follows:
- 50.3% of Belron, the world’s largest vehicle glass repair, replacement and recalibration business and the jewel in D’leteren’s crown;
- 100% of D’leteren Automotive, the VW distributor for Belgium with an approximate 23% market share in the country, together with servicing and resales;
- 91% of Parts Holding Europe, a French based vehicle parts distributor in six countries;
- 40% of TVH, a parts distributor for material handling, construction, industrial and agricultural equipment; and
- 100% of Moleskine, an up-market stationary business.
The company also has a property subsidiary which owns and manages group sites, mainly for the automotive business but has its own third-party developments.
We covered D’leteren in QR#5 (March 2024) which details each of the five businesses and QR#7 (September 2024). The latter piece was a preliminary assessment of the change to capital structure brought about by the D’leteren branch of the family acquiring most of the stake held by the Perier-D’leteren branch. Since that time, the shares have advanced ~28% adjusting for the special dividend of €74/share paid in December 2024, excluding any tax impacts, but have peeled back around 20% from the August 2025 highs of ~€191.
Investors in D’leteren have faced a quandary since the group, in total, is now subject to significantly greater leverage with individual units paying hefty dividends and capital returns to the parent to facilitate the ~€4bn special dividend payout at a time when some of them are coming under greater cyclical pressure.
Consequently, reported profit across the group and at individual units is well down on prior periods reflecting this environment and higher financing costs. Our assessment of D’leteren is very much based around a sum of the parts analysis and treats the company as an “investment entity” despite the automotive retail/resale/servicing business being fully owned, together with Moleskine and the >90% ownership of Parts Holding Europe (PHE).
In our opinion, these adverse cyclical issues are bringing other negative aspects of D’leteren to the fore, such as:
- Opacity and complexity – D’leteren does a respectable job of segmental reporting but uses numerous alternative metrics, doesn’t give clear pre and post IFRS16 EBITDA measures, attributes significant “abnormal items” (in fairness, mainly non-cash goodwill or contract amortisation) on a divisional basis;
- Very opaque “Corporate and Unallocated” which does not properly segment property income or assets9 or corporate costs10 or how charge backs (if any) are made to D’leteren Automotive; and
- Investors’ disbelief in the private equity valuation of Belron.
As a guide to the latter point, if our valuations of the non-Belron assets are deemed reasonable, the notional full value of D’leteren per share (before tax) assuming the October 2024 equity valuation of Belron (see below) would be ~€273/share comprised of €63 of other businesses, €220 of Belron and (€10) of debt. This suggests the shares trade at a 45% discount to a full valuation.
Clearly management have a more optimistic view than us. Aside from positive comments regarding Belron on a recent conference call (see later), on 22 December 2025, the company announced a €100million stock buyback program which at prevailing prices would retire around 1.2% of equity or 3% of current free float. This reflects the parent company having reduced its debt from €1billion post the special dividend to €500million.
As we did in September 2024, we have recut our sum-of-the-parts table to establish the price we believe we are paying for Belron, with D’leteren being the only publicly listed avenue for entry to this outstanding business:
Automotive: cash strip and down-cycle reduces valuation
Automotive (DA) is coming off a hefty cyclical peak in H1 CY2024 when EBIT margins reached a record high of 5.5% on total revenues of €2,863million; in H1 CY25 DA new car sale volumes fell sharply from just over 68,000 to 53,000 but revenue and margin was assisted by a 13% increase in average vehicle pricing for new cars.
DA used cars and servicing revenues fell by ~7% in H1CY25 and EBIT was barely ahead of H2CY24 at €115million, down some 27% on the corresponding period. There are some minor signs of a levelling out of the decline, with the Belgian new sales market down 8.9% in the ten months through October versus ~10% in the first six months.
We have scaled down our valuation of DA on two counts – the cyclical downturn has been marginally greater than we previously envisaged, but far more meaningfully , the parent stripped €400million in dividend from DA to assist in debt reduction after the parent special dividend of 2024. DA is carrying ~€450million of net debt as a result.
Our main listed peer is the Australian-listed AP Eagers (APE.AX), which trades at a significant premium rating (~22x P/E) as a result of strong performance but a significant property portfolio, which in D’leteren is held within the D’leteren Immo “corporate” segment. However, in October 2025, APE made a significant investment in CanadaOne, a €3.35billion turnover, €135million pre-tax profit, 42 location dealership (mainly Ontario and Alberta), with an extensive freehold property portfolio. The business becomes effectively a JV between APE and the Priestner family, who have facilitated the €590million deal.
The deal metrics effectively price the vehicle sales business at 7.5x pre-tax profit and EV/EBITDA of 6.7x based on the year to 30 June 2025. Applying these metrics to DA gives a narrow valuation range, either side of €1400million – a marginal €100million reduction in equity value adjusting for dividend versus our estimate fifteen months ago.
PHE: expanding into a €100billion market
D’leteren acquired PHE from Bain Capital in August 2022 for an equity value of €571m added to ~€1,130m of acquired debt for an enterprise value of €1.7bn. Management and staff own 9% of the business. The business continues to maintain these debt levels, with significant working capital fluctuations and small dd-on acquisitions outside of the major market of France (over 60% of sales).
In other markets, notably USA, parts distributors command high multiples of earnings – listed cohort O’Reilly and Auto Zone trade at P/E’s in the high 20’s and EV/EBITDA multiples of 15-21x. These reflect entrenched positions but extremely high returns on invested capital of over 40%pa. Since it is in an expansionary phase, in more segmented markets, PHE’s ROIC sits at just above 15%. Operating results have held up well, despite slow growth in France because of the newer expansions, and in the 2025 year should just exceed the 2024 out-turn of €257million operating profit (before amortisation).
Since the acquisition by D’leteren, sales have grown sharply and should have reached ~€2.9billion in the year just ended, for 8.5% compound per annum growth. The business is riding a number of global trends seen in the auto market, namely the ongoing aging of ICE vehicles and the increased penetration of independent aftermarket suppliers versus original equipment manufacturers. There is still significant growth runway for PHE given the ~€100billion European distribution aftermarket and potential in the BEV environment.
We believe the equity value is above the level paid as a result of the impact of gearing and increased operating profits since acquisition. Based on an expected NPAT around €112million for the 2025 year, we would evaluate D’leteren’s 91% stake in PHE at a multiple of just under 12x for a value ~€1.2billion.
TVH (40%): tougher environment translates to profit declines
D’Ieteren acquired 40% of TVH from the vanHalst family in late 2021 for a price of €1,172million; the founding Thermote family retain the other 60%. TVH is the world’s largest independent supplier of after-market parts for material handling and construction equipment such as forklifts, scissor lifts and other “rolling” equipment. TVH are also a global top three player in the same market for tractors. TVH has a completely global platform, stocks ~1million separate items and is in 26 countries with revenue split c. 60/40 EMEA/America with a small percentage in APAC.
TVH has encountered tough conditions since D’Ieteren’s acquisition of the stake. The company was the subject of a cyber-attack in March 2023 and more recently subdued conditions in both materials handling (57% of turnover) and construction equipment (~20% of sales) allied to tariff uncertainties – Americas are over one third of sales – have subdued activity and impacted sharply on operating margins. In H1 2025, operating margin fell from 16.8% to 14.2%, reducing operating profit by 15% over the corresponding period to €121million. In addition, the company paid a significant dividend of €112million (D’Ieteren share €45million) which has pushed up debt to €856million.
We don’t expect a material improvement in TVH to have occurred in H2 2025 based on the late August decision to part ways with the seven-year tenured CEO and the current lack of permanent replacement. It is likely that operating profit for 2025 will be down around the €220million mark (100% basis) – 16% below 2024. With interest charges far higher than in 2024, at around €50million, after tax profit for the group will probably be around €110million. Given the estimated attributable profit to D’Ieteren of some €44million, allowing for multiple maintenance given the cyclical nature of the downturn, we believe the stake to be worth ~€700million – a decline of over €450million versus acquisition cost.
Belron: getting closer to a monetisation?
As the sum of the parts table illustrates, in common with their perceptions of private equity “marks” elsewhere in public markets, equity investors simply don’t believe the valuation attributed to Belron in the private equity deals in 2021 and 2024. The progression of Belron’s valuation, first shown in March 2024, is updated below:
The intrigue is that the Clayton, Dubilier & Rice SPV formed in late 2021 as a “continuation” buyout fund, with ten limited partners, and will become five years old in a year’s time. This is typical exit-timing for a buyout style fund, but with D’Ieteren having slight majority control and shareholder agreements, a potentially lengthy negotiating process will likely ensue. Our view is that monetisation of the SPV is most likely into the public markets, despite the downbeat attitude towards IPO’s with potential (small) new capital raised as part of the process. We suspect D’Ieteren will not sell down any of their equity, and will not be keen to be heavily diluted by a primary capital raising.
Despite some minor negative issues in H1 CY2025, Belron remains a free cash flow generating machine. The first half of the year saw revenues grow around 4% but operating profit up 5% over the corresponding period. This disguised such issues as:
- Front end loaded costs, in advertising and technician recruitment;
- Modest US volume growth, which appears to have quickened in the second half of the 2025 year;
- Issues with US glass prices because of tariffs, but where increases have been pushed through from September onwards; and
- “Claims avoidance” where customers are reluctant to use insurance for claims on windshields and pay in cash as a result of insurance price increases in 2024. Belron’s US business “Safelite” has a strong relationship with insurers and has had to adapt in recent years to an increased “cash” market place. The company notes premium rate increases are now normalising.
Recent management conference calls have affirmed a stronger margin in H2CY2025 than in H1; our estimates suggest operating profit (before abnormals) up around 7.2% in 2025 over 2024 at €1.47billion. Finance charges are far higher than 2024 with net debt around €8.4billion. This should yield pre-tax cash flow of around €850million after finance charges (~€500million) and net capex of €120million (H1 €392mn).
At prevailing prices of D’Ieteren, we believe we are paying just over 15x 2025 net earnings for Belron, roughly half of the last transaction price of the company’s equity, which we view as being a real stretch. The implied P/E is compressed by the debt load but the effective 4.75% equity free cash flow yield is more than acceptable for such a strong cash flow generator, with ongoing regulatory and market tail-winds.
In the event that we are too conservative, and Belron is monetised into public markets at the levels of late 2021, we believe D’Ieteren stock will be upwardly rated, the more so if D’Ieteren were to unexpectedly sell a small portion (say 10% of the 50%) of their holding.
Aviation PLC: options abound in an asymmetrically priced aircraft leasing business
In QR#9 in March 2025, we discussed aircraft leasing in some detail with a specific security focus. We have followed the sector for some years, and are well aware of some of its shortcomings and risks. With their significant leverage aircraft lessors are akin to a bank and are effectively credit risk arbitrageurs, taking bond and bank money and lending via secured asset (airplane) leases to potentially lower credit rated counterparties. This means they generally attract low multiples/rating of profit and net asset value as, historically, have banks around the world (except Australia, because that’s different, until it’s not).
Along with travel retail, we view aircraft leasing, certainly at the present time, as an advantaged way of gaining exposure to global passenger growth in air travel. 2025 to date – to October – has shown the expected strong growth in international travel numbers both via IATA figures and Airports Council International projections, which are measured differently. Both confirm 5-7% growth in international passengers, and 2-3% improvement in domestic passenger numbers.
Hence, the underlying environment for lessors has been and remains exceptional. Lease rates have improved marginally for lessors, cost of money has been relatively stable, capacity utilisation is close to 100% with limited availability, especially of narrowbody jets, and aircraft sale prices relative to book value have exhibited significant premium. There has even been a very sweet cherry on top, with a number of lessors receiving insurance proceeds in Q3 CY2025 from losses incurred via the 2022 Russian invasion of Ukraine, subsequent sanctions and impounding of aircraft. Share prices have risen respectably over the past nine months: AerCap, the market leaders (+41%), BOC Aviation (2588.HK) up 20% and Air Lease Corporation +32%, aided by a takeover at net asset value from a consortium of SMBC (#3 globally before the deal), Brookfield and Apollo.
There are some minor issues with this success. One of the key contributions to shareholder return – equity versus aircraft arbitrage, being the ability to sell planes at a large premium to book and buy-back equity at a significant discount – has closed up. Market leader AerCap advanced to a premium to book value early in 2024 and now trades at a meaningful and record ~30% premium, having traded at persistent, if occasionally smallish discounts since 2008. Furthermore, investors’ capacity to gain exposure to the sector has been reduced to AerCap, BOC Aviation, the world’s fourth largest lessor by aircraft book value, but listed in Hong Kong and effectively 70% controlled by PRC Government, three other Chinese lessors (Bohai – who own Avalon, the third largest lessor after the AirLease deal – CDB and CALC) and Avation. The market has consolidated dramatically over recent years with Japanese, Middle Eastern sovereign wealth fund money and Chinese quasi-Government sponsored firms together with smatterings of private equity funds acquiring smaller players. AerCap’s acquisition of GECAS in 2021 looks ever smarter. In turn, public market analysis of the sector is now substantially depleted.
The outlier, in share price terms, but not business positioning is Avation PLC, a 32 plane Singapore-based UK listed lessor. The company has progressed meaningfully in the space of nine months, significantly reducing financial risks, whilst the shares have done – nothing. As a consequence, the shares trade at around an 18% discount to net asset value, excluding aircraft purchase rights.
Since end-March 2025, when we wrote up the company in detail, Avation has:
- Seen its largest 15.9% shareholder exit the register;
- Bought back over half of the departing holder’s shares at an average price of ~£1.46/share;
- Refinanced the 8.25% US$300million bond due to mature in October 2026 with $300million of 8.5% coupon unsecured notes maturing in May 2031;
- Completed the sale of a Boeing B777-300ER to Titan Aviation Leasing (a JV of Atlas Air and Bain Capital) at above book value and freeing up $33million of cash proceeds;
- Extended the lease of an Airbus A330-300 to Eva Air (Taiwan) by four years;
In its core ATR72 turbo prop market, Avation:
- sold off a new delivery for a $5million cash profit;
- placed out three of four existing leases expiring by 30 June 2026; and
- placed out two new ATR72-600’s for delivery before April 2026 on 12 year leases to Sum Air (Korea) and a Cambodian airline;
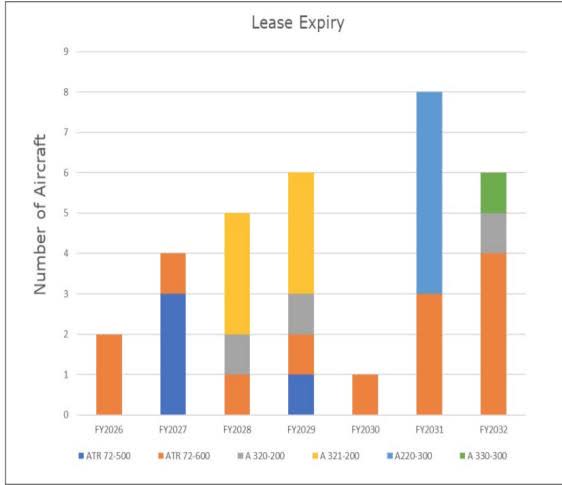
At 26 November 202511, Avation now has its lowest net debt since June 2015 at $485.5million (including restricted cash). So by 30 June 2026, Avation will have 34 operational leased aircraft, with four new deliveries in each of FY27 and FY28 (to end June) to add to 3 expiring leases on 14year old ATR72-500’s currently leased to FIFO airline Airlink in Australia and one ATR72-600 expiring in the year to 30 June 2027
The issue for equity holders is relatively simple: the company by past standards is in rude financial health and has access to an additional US$700million debt under a $1billion GMTN note program. BUT the company has its smallest plane fleet in ten years (32) which IF it can re-lease all existing expiries (see RHS) chart, will grow by 4 per year to 2028 and if all ATR-72 purchase rights can be exercised, by a further four per annum out to 2034. Given current lease rates and spreads Avation’s fleet additions in FY27 and FY28 should add ~$4.5million net to EBITDA. On our modelling, by end FY28, Avation should be generating over US$55million pa in GROSS cash flow (pre asset acquisitions) – attractive for a US$115million equity value company.
That’s attractive but depends on Avation re-leasing all expiries – which should be possible – but from recent public communications, appears to leave management underwhelmed. But their problem in forcing more rapid growth through asset acquisition, is that assets are available, but expensive. In fairness, only a small number of opportunistic deals – such as the February 2025 acquisition of an A320 on lease to Etihad – are required to move the needle. However, investors seem very wary of past history, where the last aggressive growth push preceded a significant decline in equity value, albeit due to COVID leaving the company a forced seller of assets.
Moreover, we suspect that further aggressive share buybacks are unlikely and the Chair – the largest shareholder with over 20% – has ruled out selling the company, at least at anywhere near prevailing equity prices. But what would Avation potentially be worth NOW if it were sold? This is relevant since this is the benchmark against which the board (and ourselves as investors) must compare alternatives to be a holder for (SAY) a further 2-2.5 years.
In context, whilst Air Lease transacted at NAV, Avation’s adjusted NAV but excluding purchase rights, and adjusting for share buybacks after 30 June 2025, equates to around US$2.28/share. That can be supplemented by ~US$1.32/share marking the fleet to market based on past announcements12 giving a full market value (before tax) of US$3.60/share equivalent to ~£2.70, being a 95% premium to the prevailing share price.
In addition , purchase rights, which fluctuate in value given the use of Black-Scholes option techniques, currently add a further US$91million (currently US$3.8million per plane average over the 2028-2034 period) or ~£68million (~£1.09/share) taking full value to ~£3.80/share.
The US$3.8million undiscounted premium per plane effectively represents a rough 15-16% premium to market value of a new ATR. The planes are likely to be in short supply for some time given that ATR are only manufacturing 35per annum at present, aiming to ramp up to 60. But ATR themselves at the June 2025 Paris Airshow, forecast demand for “turboprops” – of which they are the only current manufacturer averaging 105per year over the next 20 years – 2100 new panes of which over half are for the replacement market. Moreover, the environmentally advantaged turboprops are ideal in the Asia-Pacific region, the strongest growth area for shorter haul flights, and forecast to consume 40% of the demand out to 2045. This is Avation’s key market with its existing fleet spread across 11 APAC nations (13 by June 2026).
A strong guide as to the role of ATR72-600s can be gleaned from Bangkok Airways – a key Thai regional airline capitalised at US$975million – which ordered 10-12 new planes in November 2025 for fleet replacement and expansion purposes with the aim of increasing its current fleet size from 23 to 40 over the next few years.
Whilst an acquiror may not be tempted to pay full value, we feel a respectable benchmark is the market value NAV of ~£2.70. Given that the assets are reasonably fungible, how does that compare with continuing to operate the company?
If we take a 2.5-year timeframe, through FY28, and Avation can release all expiring planes, the lessor should have a 40-strong fleet, generating top line revenues of ~$120million per annum, against a debt cost of around $50million and assumed administration costs in the vicinity of $15million. Hence, gross cash flow on a steady state basis should be ~$55million. That’s nearly around half the cost of the new fleet, theoretically restricting the need for debt drawdowns. But when your equity is so cheap to investors (ludicrously expensive to the company) you want to be retiring it.
So our figuring is that the company should be able to easily afford to retire 10% of capital each year for the next 2.5years reducing share count to well below 50million issued shares by June 2028, as well as being able to add 4 new ATR72-600’s to the fleet for those next two years.
Reported earnings are depressed by depreciation charges around $46million by that year, but with an element of cash flow retention we can see post tax earnings of around 17p per share in the FY28 year, so long as all planes remain leased. Whilst that equates to a P/E of ~16x at the “benchmark” price of ~£2.70, an acquiror within two years’ time would get the benefit of knocking out significant administration costs.
Hence, we have recently lifted our weight to Avation feeling that whilst lessors always have an inherent level of risk given potential airline disruption and leverage, the prevailing situation is as low risk as Avation has been in some years.
Footnotes
- Measured by NASDAQ 100
- Ackermans and van Haaren
- Exor NV
- Prosus
- Significant material and background sourced from “The History of Rea Brothers” by Nigel Watson (1994, James and James)
- Alto Parana features in the 1927 manuscript “Investments Abroad” by A. Emil Davies (AW Shaw Company) in the chapter “London as a market for foreign investments”.
- The well-known and (long term) well performed FTSE-250 constituent Finsbury Growth and Income Trust, managed since 2017 by Lindsell Train, was created in this period.
- Investment Policy 1996 Annual Report Finsbury Trust PLC
- Our queries to D’leteren investor relations on this subject went unanswered
- Belgian corporate filing enable a full balance sheet and P&L of D’leteren Immo which assists
- Chairman’s AGM Statement 26 November 2025
- “Response to Analyst Question” 12 June 2025 company announcement
Original Post
Editor’s Note: The summary bullets for this article were chosen by Seeking Alpha editors.
Read the full article here