Investment Thesis
The First Trust Health Care AlphaDEX Fund ETF (NYSEARCA:FXH) is a well-established fund with a 17-year track record, $1.26 billion in assets under management, and a 0.62% expense ratio. Historically, it’s lagged behind broad-market benchmarks like the Health Care Select Sector SPDR Fund ETF (XLV) and the Vanguard Health Care Index Fund ETF Shares (VHT), and given its high annual fee, it’s likely not optimal for long-term investors. However, FXH’s short-term prospects are better, as it trades at a 30% discount on forward earnings compared to XLV, offers greater sales and earnings growth, and doesn’t make big quality sacrifices like other sector ETFs following the AlphaDEX methodology. As a result, I’ve assigned FXH a “buy” rating, and I look forward to explaining why in further detail below.
FXH Overview
FXH tracks the StrataQuant Health Care Index, selecting Russell 1000 securities the Index provider expects will outperform broad-market Health Care benchmarks on a risk-adjusted basis. According to the fund’s prospectus and fact sheet, the selection process is as follows:
1. The eligible universe includes all Health Care securities in the Russell 1000 Index meeting the Index’s share class and liquidity screens.
2. Each security is ranked separately on the growth and value factors. Growth metrics include three-, six-, and twelve-month price appreciation, sales to price, and one-year sales growth. Value metrics include book value to price, cash flow to price, and return on assets.
3. The Index chooses a growth or value score for each security based on its style designation as determined by Russell. In cases where Russell designates a security as growth and value, the Index uses the better score.
4. The greater of the top 75% of the eligible universe or 40 securities form the Index. Securities are divided into quintiles based on their scores, with top-ranked stocks receiving a higher weight.
5. The Index is reconstituted and rebalanced quarterly.
The weighting scheme is modified equal-dollar weighted, which can substantially impact fundamentals compared to market-cap-weighted funds even if the selections are the same. A handful of companies often dominate sectors, so instead of the top ten holdings comprising 51% of the portfolio, as with VHT, FXH’s total is only 23%.
First Trust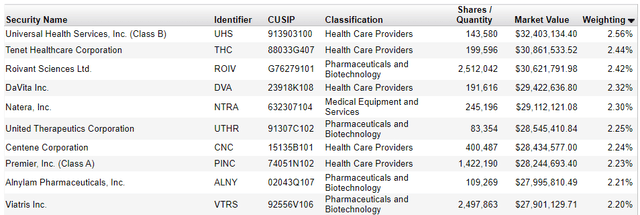
Eli Lilly (LLY) and UnitedHealth Group (UNH) dominate with over 20% combined exposure in market-cap-weighted funds, but in FXH, they are not even in the top ten. Instead, Health Care Providers like Universal Health Services (UHS) and Tenet Healthcare (THC) are at the top. The takeaway is that FXH could be used for diversification purposes if you’re concerned about VHT’s high concentration level.
The classifications in the above table are based on ICB framework. Under GICS framework, please note the following allocation differences by sub-industry between FXH, XLV, VHT, the SPDR S&P Biotech ETF (XBI), and the SPDR S&P Pharmaceuticals ETF (XPH). I’ve included XBI and XPH because they are FXH’s most prominent sub-industries, with a 39% combined allocation.
The Sunday Investor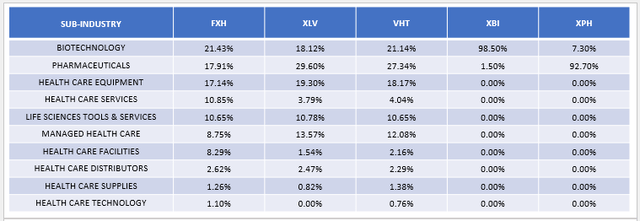
Compared to XLV and VHT, FXH underweights Pharmaceuticals and Managed Health Care stocks by about 10% and 4% on average. The offsets are overweights to Health Care Services and Health Care Facilities by about 6-7% each. In addition, FXH underweights AbbVie by approximately 5%, but distributes the weight well among other Biotechnology stocks.
An important caveat to this analysis is that FXH is a high-turnover fund. According to its latest annual report, turnover has been around 100% in each of the last five years, indicating that you should expect the above allocations to change, sometimes significantly, with each quarterly rebalance.
First Trust
FXH Analysis
Performance Snapshot
The following chart summarizes FXH’s performance against XLV, VHT, XBI, and XPH since its May 31, 2007, inception date. Through September 10, 2024, FXH has gained 452.28% compared to 473.22% and 493.06% for XLV and VHT, respectively. XBI’s 475.25% total return shows biotechnology stocks doing well, while XPH’s 216.44% suggests that pharmaceuticals struggled.
Morningstar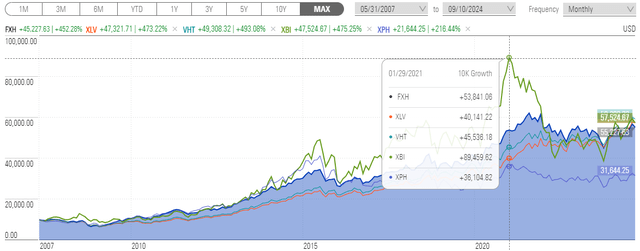
This 10K growth chart also highlights how FXH’s returns peaked in January 2021, seemingly driven by Biotechnology stocks based on XBI’s spike around the pandemic. An analysis of annual returns over the last five years between FXH, VHT, and XBI confirms this. XBI gained 48.33% in 2020 compared to 18.27% for VHT.
Portfolio Visualizer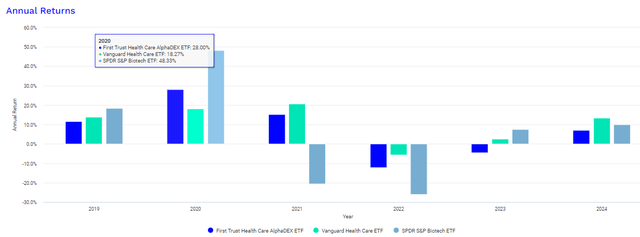
According to the fund’s semi-annual report, as of January 31, 2021, Moderna (MRNA) was FXH’s top holding at the time. The stock gained 434% that year, and by early January, the company’s COVID-19 vaccine received approval to be administered in emergency situations in the United States. After another 143% gain in 2021, the stock quickly retreated in subsequent years, declining by 29%, 45%, and 20% in 2022, 2023, and 2024 YTD.
Due to this event, analyzing FXH’s historical returns is challenging, and I don’t think much of it is relevant anymore. However, Portfolio Visualizer provides additional information that reveals FXH did not achieve its objective of delivering superior risk-adjusted returns than its benchmarks. As shown below, its Sharpe Ratio of 0.61 since June 2007 is lower than VHT’s 0.69 figure, resulting from lower returns and higher volatility.
Portfolio Visualizer
Importantly, FXH’s extra risk was not beneficial. The gap between the two fund’s Sortino Ratio (0.91 vs. 1.07), a measure of downside risk-adjusted returns, is even wider. These statistics imply that FXH shareholders should prepare to sacrifice some downside risk protection to achieve the better value and growth metrics its Index seeks. On that note, let’s take a closer look at the fundamentals.
FXH Fundamental Analysis
The following table highlights selected fundamental metrics for FXH’s top 25 holdings, totaling 51.59% of the fund. This concentration is far less than XLV’s and VHT’s and results from FXH’s modified equal-dollar weighting scheme.
The Sunday Investor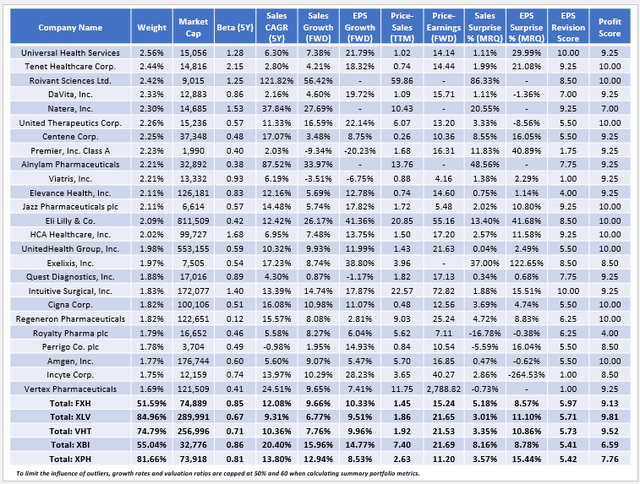
Here are four additional observations to consider:
1. FXH’s 9.13/10 sector-adjusted profit score is excellent considering its lower $74.9 billion weighted average market cap figure. Generally, quality declines with size, but this score indicates many potential good picks beyond top stocks like Eli Lilly and UnitedHealth Group. This was not the case with the First Trust Consumer Discretionary AlphaDEX Fund ETF (FXD), as its profit score of 7.57/10 was more than two points behind XLY’s. In this review, I reasoned this negatively impacted long-term returns, but for the opposite reason, I think this feature helps to explain why FXH has performed well since its inception.
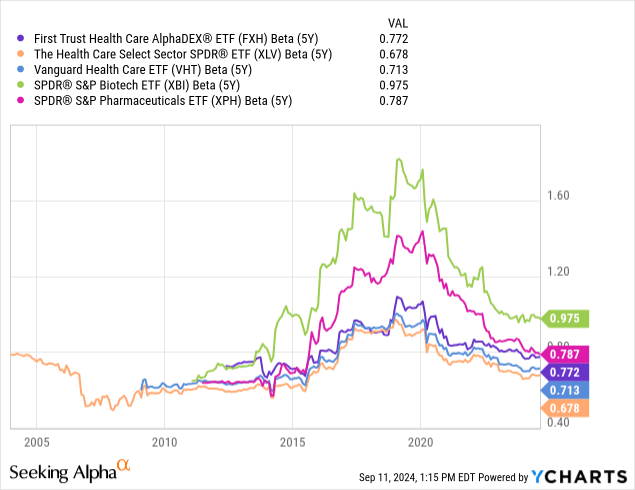
2. FXH’s higher volatility is reflected in the fund’s 0.85 five-year beta based on its current holdings. Please note that YCharts lists FXH’s five-year beta as 0.77, but that’s not as relevant because of the fund’s high portfolio turnover. However, the trend chart below does an excellent job of showing how beta can change over time. The spike you see in 2020 relates to the pandemic, but ultimately, FXH’s beta is always broad-market benchmarks like XLV and VHT.
3. FXH’s growth and value combination is excellent. The portfolio trades at 15.24x forward earnings, which is 30% less than XLV’s 21.65x figure, and it trades 22% cheaper on trailing sales (1.45x vs. 1.86x). Meanwhile, FXH’s holdings are expected to grow sales and earnings per share 1-3% faster over the next year and have increased sales 2-3% per year faster over the last five.
4. According to FactSet Research, S&P 500 Index Health Care stocks delivered an 8.6% aggregate earnings surprise in Q2 2024, the second-best result behind Utilities (9.5%).
FactSet Research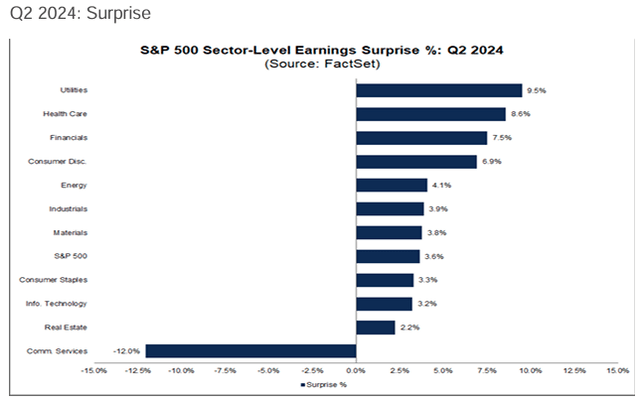
On a weighted average basis, the result was even more impressive at 11.10% (see table above). FXH’s result, while slightly lower at 8.57%, indicates the sector has some momentum, as does its 5.18% sales surprise, which was better than XLV’s. I believe it’s worth exploring FXH to diversify away from large-cap Technology stocks and reduce your portfolio’s P/E.
The caveat is to use FXH only as a short-term tactical play. Historical results indicate you’ll achieve better risk-adjusted returns with passive benchmarks like XLV and VHT, and while the 0.62% expense ratio is a major deterrent over the long run, its impact is relatively small over the short term. The reason is that fees compound, but the effect is negligible if you shorten your time horizon to less than a year. Feel free to explore different fee scenarios using this calculator.
Investment Recommendation
Unlike other First Trust sector ETFs following the AlphaDEX methodology, FXH offers a substantial valuation improvement over its benchmarks without sacrificing quality. Its 1.45x trailing price-sales and 15.24x forward price-earnings ratios represent a 22-30% discount compared to VHT, and combined with more robust sales and earnings growth and superior diversification, this portfolio looks solid. As a result, I’ve assigned FXH a short-term “buy” rating, and I look forward to answering any questions you might have in the comments below. Thank you for reading.
Read the full article here


