
Investment Thesis
Wouldn’t it be nice to have an investment portfolio that helps you steadily increase your wealth and additionally contributes to covering your day-to-day expenses? Imagine an investment portfolio that helps you to pay your internet bill, covers your gas expenses or even helps you pay for your next vacation!
In today’s article, I will show you how you could allocate the amount of $50,000 among 20 dividend paying companies/ETFs, which I believe are attractive right now!
This portfolio not only offers investors an attractive Weighted Average Dividend Yield [TTM] of 3.86%; it also comes attached to a reduced level of risk (due to its extensive diversification) and has shown an attractive Weighted Average Dividend Growth Rate [CAGR] of 10.81% over the past 5 years.
With an investment of $50,000 and a Weighted Average Dividend Yield [TTM] of 3.86%, you could earn the amount of $1,930 per year in the form of dividends (please note that no withholding taxes have been included in the calculation).
In addition to that, you should be able to raise this amount on an annual basis (underscored by the portfolio’s Weighted Average Dividend Growth Rate [CAGR] of 10.81% over the past 5 years).
Due to its broad diversification (no individual company has a proportion of more than 5% of the overall portfolio in addition to the fact that no industry accounts for more than 12%), this portfolio comes attached to a reduced risk level, increasing the likelihood of attractive investment results. It is further worth mentioning that this approach reflects the investment approach of The Dividend Income Accelerator Portfolio, which I am currently building and can be followed here on Seeking Alpha.
The Dividend Income Accelerator Portfolio’s objective is the generation of income via dividend payments, and to annually raise this sum. In addition to that, its goal is to attain an appealing Total Return when investing with a reduced risk level over the long term.
In two previous articles, I mentioned that I consider the following high dividend yield picks and dividend growth picks to currently be particularly attractive:
- Altria (NYSE:MO)
- Boston Properties (NYSE:BXP)
- Philip Morris (NYSE:PM)
- Rio Tinto (NYSE:RIO)
- The PNC Financial Services Group (NYSE:PNC)
- Realty Income Corporation (NYSE:O)
- United Parcel Service (NYSE:UPS)
- Phillips 66 (NYSE:PSX)
- Verizon Communications (NYSE:VZ)
- Comcast (NASDAQ:CMCSA)
- Mastercard (NYSE:MA)
- Apple (NASDAQ:AAPL)
- Visa (NYSE:V)
- Royal Bank of Canada (NYSE:RY)
- Bank of America (NYSE:BAC)
- The Home Depot (NYSE:HD)
- McDonald’s (NYSE:MCD)
- American Express (NYSE:AXP)
- Charles Schwab (NYSE:SCHW)
- Schwab U.S. Dividend Equity ETF (NYSEARCA:SCHD)
In the following, I will show you how I would allocate the amount of $50,000 among the Schwab U.S. Dividend Equity ETF and these dividend paying companies. I consider the Schwab U.S. Dividend Equity ETF to be particularly attractive due to its combination of dividend income and dividend growth, in addition to its appealing risk/reward profile.
Overview of the Selected Companies/ETFs for the Month of October
|
Symbol |
Company Name |
Sector |
Industry |
Country |
Dividend Yield [TTM] |
Dividend Growth 5 Yr [CAGR] |
P/E GAAP [FWD] |
Net Income Margin |
Return on Equity |
60M Beta |
Allocation |
Amount in $ |
|
MO |
Altria |
Consumer Staples |
Tobacco |
United States |
9.02% |
5.85% |
9 |
33.13% |
NM |
0.69 |
4% |
2000 |
|
BXP |
Boston Properties |
Real Estate |
Office REITs |
United States |
7.40% |
3.19% |
21.48 |
20.99% |
9.96% |
1.2 |
2% |
1000 |
|
PM |
Philip Morris |
Consumer Staples |
Tobacco |
United States |
5.62% |
2.94% |
17.86 |
23.38% |
NM |
0.8 |
3% |
1500 |
|
RIO |
Rio Tinto |
Materials |
Diversified Metals and Mining |
United Kingdom |
6.66% |
5.48% |
7.76 |
16.39% |
15.53% |
0.69 |
3% |
1500 |
|
PNC |
The PNC Financial Services Group |
Financials |
Diversified Banks |
United States |
5.56% |
12.40% |
8.18 |
29.76% |
13.13% |
1.12 |
4% |
2000 |
|
O |
Realty Income Corporation |
Real Estate |
Retail REITs |
United States |
6.19% |
3.70% |
37.19 |
23.51% |
3.02% |
0.87 |
5% |
2500 |
|
UPS |
United Parcel Service |
Industrials |
Air Freight and Logistics |
United States |
4.31% |
12.38% |
16.3 |
10.41% |
55.10% |
1.09 |
3% |
1500 |
|
PSX |
Phillips 66 |
Energy |
Oil and Gas Refining and Marketing |
United States |
3.64% |
6.55% |
7.23 |
7.07% |
40.85% |
1.33 |
3% |
1500 |
|
VZ |
Verizon Communications |
Communication Services |
Integrated Telecommunication Services |
United States |
8.35% |
2.02% |
6.95 |
15.58% |
23.39% |
0.39 |
3% |
1500 |
|
CMCSA |
Comcast |
Communication Services |
Cable and Satellite |
United States |
2.66% |
9.40% |
12.27 |
5.40% |
6.93% |
1.05 |
2% |
1000 |
|
MA |
Mastercard |
Financials |
Transaction & Payment Processing Services |
United States |
0.59% |
17.92% |
32.28 |
43.37% |
172.79% |
1.07 |
3% |
1500 |
|
AAPL |
Apple |
Information Technology |
Technology Hardware, Storage and Peripherals |
United States |
0.54% |
6.69% |
28.56 |
24.68% |
160.09% |
1.31 |
4% |
2000 |
|
V |
Visa |
Financials |
Transaction & Payment Processing Services |
United States |
0.77% |
16.89% |
28.32 |
51.94% |
44.40% |
0.95 |
3% |
1500 |
|
RY |
Royal Bank of Canada |
Financials |
Diversified Banks |
Canada |
4.85% |
6.24% |
10.62 |
27.28% |
13.51% |
0.78 |
4% |
2000 |
|
BAC |
Bank of America |
Financials |
Diversified Banks |
United States |
3.42% |
12.03% |
7.76 |
31.52% |
10.96% |
1.39 |
4% |
2000 |
|
HD |
The Home Depot |
Consumer Discretionary |
Home Improvement Retail |
United States |
2.85% |
15.47% |
18.83 |
10.48% |
2065.27% |
0.93 |
2% |
1000 |
|
MCD |
McDonald’s |
Consumer Discretionary |
Restaurants |
United States |
2.36% |
8.52% |
22.69 |
33.06% |
NM |
0.7 |
3% |
1500 |
|
AXP |
American Express |
Financials |
Consumer Finance |
United States |
1.64% |
10.01% |
12.59 |
14.74% |
31.26% |
1.21 |
3% |
1500 |
|
SCHW |
Charles Schwab |
Financials |
Investment Banking and Brokerage |
United States |
1.91% |
18.79% |
18.8 |
30.14% |
16.86% |
0.94 |
2% |
1000 |
|
SCHD |
Schwab U.S. Dividend Equity ETF |
ETF |
ETF |
United States |
3.78% |
13.69% |
40% |
20000 |
||||
|
3.86% |
10.81% |
100% |
50000 |
Source: The Author, data from Seeking Alpha
Portfolio Allocation per Company/ETF
The largest position of this dividend portfolio is the Schwab U.S. Dividend Equity ETF, accounting for a proportion of 40% of the overall investment portfolio.
Providing SCHD with such a high proportion helps us to reduce the risk level of this portfolio (due to a broad diversification) while combining a relatively high dividend yield with dividend growth.
The largest individual positions of this portfolio are the following:
- Realty Income (with a proportion of 5% of the overall portfolio) (here you can find my latest analysis on Realty Income)
- Altria (4%)
- The PNC Financial Services Group (4%)
- Apple (4%) (here you can find my latest analysis on Apple)
- Royal Bank of Canada (4%) (here you can find my latest analysis on Royal Bank of Canada)
- Bank of America (4%)
The companies mentioned above have the largest proportion of this portfolio. I consider all of these companies to be attractive risk/reward choices and they all (excluding Apple) pay a relatively high Dividend Yield.
By overweighting companies which pay a relatively high Dividend Yield, we manage to raise the portfolio’s Weighted Average Dividend Yield. This means that this portfolio is even more attractive for dividend income investors that are looking for ways to generate extra income via dividend payments.
It is further worth mentioning that some of the companies that represent the highest percentage of the overall portfolio have a 60M Beta Factor below 1:
- Altria (60M Beta Factor of 0.69)
- Realty Income (0.87)
- and Royal Bank of Canada (0.78)
By overweighting companies with a reduced risk level, we further decrease the risk level of this investment portfolio and increase the likelihood of achieving attractive investment outcomes while having a long-term investment focus.
From my point of view, the companies with a lower proportion offer less attractive risk/reward profiles for investors. For this reason, I have provided them with a smaller percentage of the overall portfolio.
The graphic below illustrates the portfolio allocation per Company/ETF.
Source: The Author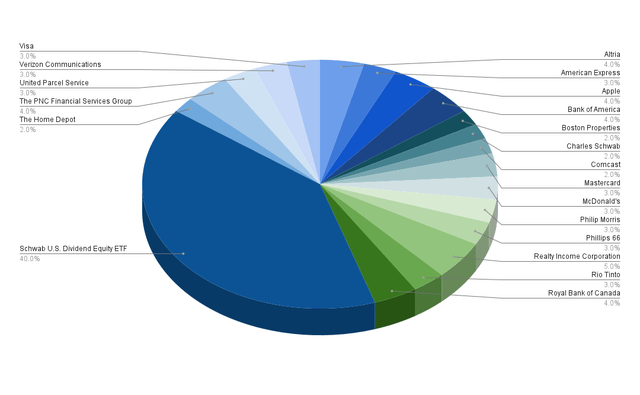
By allocating no more than 5% of the overall investment portfolio to each selected company, we enhance portfolio diversification while simultaneously reducing its risk level.
It is worth noting that regularly reviewing our investment portfolio is important to prevent any individual position with a high risk level from dominating the overall investment portfolio. Such a dominance would increase the risk level for us investors, and would reduce the likeliness of achieving attractive investment results over the long term. By not overweighting those companies that come attached to a high risk level, we further ensure to decrease the likelihood of losing money in a short period of time when investing.
In my opinion, the main reason for people losing money when investing is a lack of awareness of the risk factors that come attached to an investment. Companies with a high risk level often dominate their overall portfolio, which implies a high level of risk for investors.
For the reasons mentioned above, we should continuously ensure that the companies with the highest proportion of our overall portfolio are the most attractive in terms of risk/reward. This strategy allows us to achieve an attractive Total Return with a high probability while continuously decreasing the probability of losing our invested money.
Portfolio Allocation per Sector
The largest sector of the portfolio that I am presenting in this article is the ETF Sector, accounting for 40% of the overall portfolio.
Following the ETF Sector, the Financials Sector represents the second largest of the overall portfolio, accounting for 23%.
It is further followed by the Real Estate Sector (7%), the Consumer Staples Sector (7%), the Consumer Discretionary Sector (5%), and the Communication Services Sector (5%).
All other Sectors account for less than 5% of the overall portfolio: among these sectors are the Information Technology Sector (4%), the Energy Sector (3%), the Industrials Sector (3%), and the Materials Sector (3%).
Source: The Author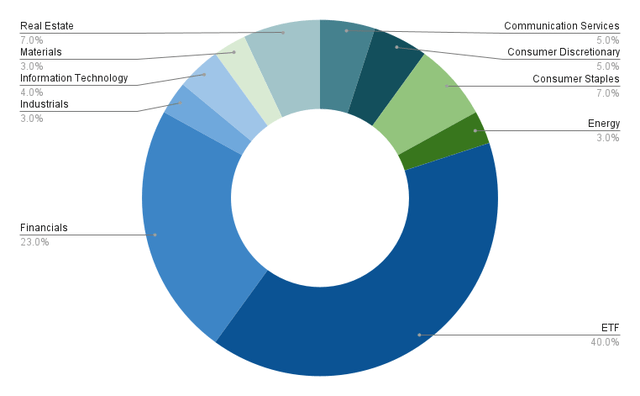
Below you can find an overview of the different sectors, companies and ETFs that are part of this investment portfolio.
ETFs (40%)
- Schwab U.S. Dividend Equity ETF (40%)
Financials Sector (23%)
- The PNC Financial Services Group (4%)
- Mastercard (3%)
- Visa (3%)
- Royal Bank of Canada (4%)
- Bank of America (4%)
- American Express (3%)
- Charles Schwab (2%)
Real Estate (7%)
- Realty Income (5%)
- Boston Properties (2%)
Consumer Staples (7%)
- Altria (4%)
- Philip Morris (3%)
Communication Services (5%)
- Verizon (3%)
- Comcast (2%)
Consumer Discretionary (5%)
- McDonald’s (3%)
- The Home Depot (2%)
Information Technology (4%)
Materials (3%)
Industrials (3%)
- United Parcel Service (3%)
Energy (3%)
Portfolio Allocation per Industry
Below you can find an overview of the industries that are part of this dividend portfolio. The ETF Industry is the largest, with a proportion of 40% of the overall portfolio.
The second largest is the Diversified Banks Industry, which accounts for 12% of the overall portfolio. The Diversified Banks Industry is represented by Bank of America, Royal Bank of Canada, and The PNC Financial Services Group, each comprising 4% of the overall investment portfolio.
The third largest is the Tobacco Industry, which accounts for 7% of the overall portfolio (with Altria making up 4% and Philip Morris 3%).
The fourth most represented is the Transaction & Payment Processing Services Industry making up 6% of the portfolio, with Mastercard and Visa each accounting for 3%.
The fifth largest is the Retail REITs Industry, with Realty Income accounting for 5%. The remaining industries account for less than 5% of the overall portfolio each.
The graphic below once again illustrates the portfolio’s extensive diversification. No industry represents more than 12% of the overall investment portfolio, except for the ETF Industry.
Source: The Author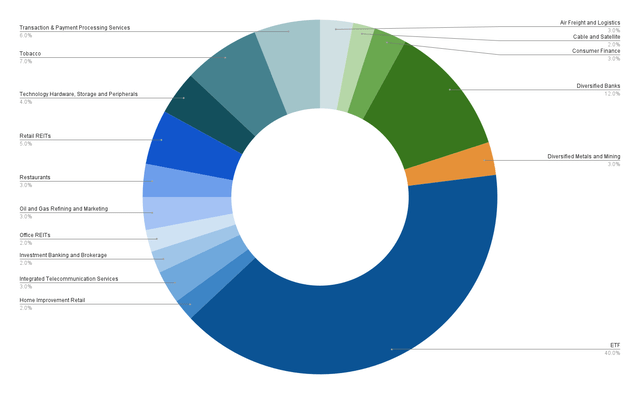
This extensive diversification raises my confidence that this portfolio comes attached to a lower risk level, enhancing the potential for attractive investment results.
Portfolio Allocation per Country
In the following, we will take a look at the portfolio’s geographical allocation.
It is worth noting that the majority of companies in this dividend portfolio are US based (93%). The other 7% has been allocated to companies outside of the country: 4% are from Canada, while 3% are from the United Kingdom.
Source: The Author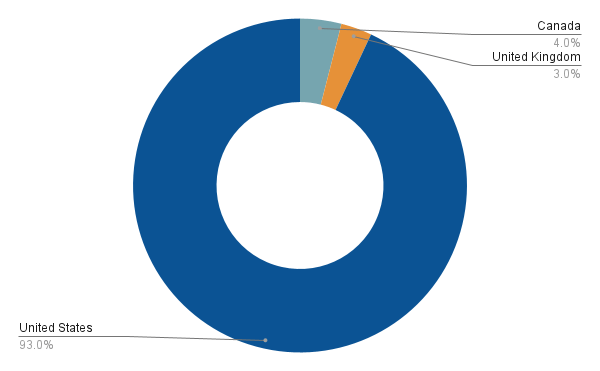
This allocation aligns with my geographical diversification strategy, which aims to overweight companies from the United States, while still maintaining a degree of international diversification.
This diversification strategy helps us to further reduce the risk level of this portfolio, once again enhancing the likelihood of achieving attractive investment outcomes when investing over the long term.
Conclusion
In the world of investing, I believe that portfolio allocation is crucial to become a successful long-term investor. I suggest to overweight those companies in a portfolio that are most attractive when it comes to risk/reward.
In today’s article, I have shown you how you could allocate an amount of $50,000 among 20 selected companies/ETFs, which I currently consider to be attractive as an investment analyst and from my perspective as an investor.
This dividend portfolio not only aims to provide you with a source of additional income, but also has the potential to obtain an attractive Total Return. This strategy is similar to the one reflected in the construction of The Dividend Income Accelerator Portfolio.
In case you are wondering if it would make sense to invest in bonds that could pay you interest higher than the Weighted Average Dividend Yield of this dividend portfolio, you should consider the following: the selected dividend paying companies are expected to provide sustainable dividends, meaning that these dividend payments will increase year over year. Moreover, always keep in mind that the Total Return of your investment comprises both dividends and capital gains. In the long run, I expect this Total Return of the dividend portfolio I have presented in this article to be above the interest offered by most bonds.
Such a dividend strategy offers significant practical advantages which you can benefit from today, including, for example, with the generation of extra income though dividends, allowing you to cover your monthly expenses without the need to sell positions of your portfolio for capital gains.
Imagine covering your next gas station bill with the dividend payments you receive from companies such as ExxonMobil (NYSE:XOM) or Chevron (NYSE:CVX), or enjoying a beer with friends in your favorite local bar using the dividends you receive from companies such as Anheuser-Busch InBev (BUD) or Heineken (OTCQX:HEINY)(OTCQX:HINKF)!
Read the full article here