Dear Partner:
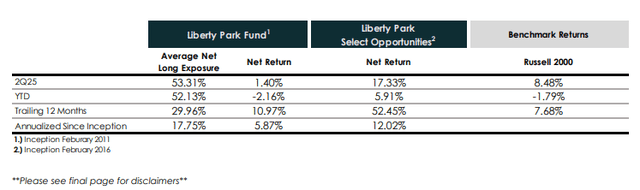
Liberty Park Fund, LP’s value increased by 1.40%, net of fees, in the second quarter of 2025 vs. an 8.48% increase in the Russell 2000. The 7.85% increase in our long positions contributed 8.22% on a weight-adjusted basis, while the 13.67% increase in our shorts detracted 6.64% on a weight-adjusted basis. Gross exposure averaged 128.77%. Net exposure averaged 53.31%. Gross Pure Alpha 1— our proprietary measure of returns generated from stock selection— was -3.14% for the quarter.
Liberty Park Select Opportunities, LP’s value increased by 17.33% net of fees, in the second quarter. Gross exposure averaged 99%.
2Q25 Performance Analysis
Stock markets fell sharply when President Trump announced new tariffs on Liberation Day (April 2), but the panic was brief. Trump delayed the tariffs’ implementation in mid-April, and markets quickly recovered to near-record levels. Liberty Park Fund (LPF) rose for the quarter but underperformed as speculative shorts surged with the market and some opportunistic long positions continued to see cyclical weakness (we think this will soon reverse). Select Opportunities did not experience the drag of short positions or LPF’s opportunistic longs.
Long Performance
|
Best Performing Longs |
||||
|
Name |
Ticker |
Return |
LPF Contribution |
Select Contribution |
|
Limbach Holdings Inc (LMB) |
LMB |
88.13% |
2.61% |
5.61% |
|
Xometry Inc (XMTR) |
XMTR |
35.59% |
2.32% |
4.17% |
|
Napco Security Technologies Inc (NSSC) |
NSSC |
14.38% |
0.94% |
2.15% |
LMB shares soared after reporting another quarter of rapid growth in its ODR segment. We expect growth will accelerate from here as the ODR segment has now scaled enough to offset the declines in the GCR business, and the cadence of acquisitions is picking up. XMTR rebounded from a drawdown caused by tariff uncertainty. The company continues to report rapid growth with its largest accounts and demonstrate operating leverage. We expect that XMTR will ultimately benefit from the increased uncertainty around tariffs and supply chains. NSSC rebounded after management communicated that it is in a better position than competitors regarding tariffs and that the inventory drawdown at its distributors has largely run its course. Growth in the services segment remains resilient and should accelerate as hardware segment sales improve.
|
Worst Performing Longs |
||||
|
Name |
Ticker |
Return |
LPF Contribution |
Select Contribution |
|
Champion Homes Inc (SKY) |
SKY |
-33.93% |
-1.01% |
N/A |
|
Lakeland Industries Inc (LAKE) |
LAKE |
-32.84% |
-0.83% |
N/A |
|
Liberty Energy Inc (LBRT) |
LBRT |
-26.97% |
-0.57% |
-0.02% |
SKY reported lower-than-expected margins due to higher-than-expected raw material costs, lower utilization at its factories caused by weather, and consumers opting for lower priced options. We think the sell-off is overdone, and we remain bullish on long-term demand for affordable housing.
LAKE’s sales in high-margin Latin American and Canadian markets fell significantly short of expectations due to tariff announcements that affected timing of orders. The company also has a substantial order that was manufactured and is prepared for shipment but has been delayed. We anticipate these challenges largely will be resolved in the third quarter. LBRT shares fell during the quarter alongside oil prices and rig count. Concerns around oversupply, weak demand, and geopolitical risk continue to keep investor sentiment muted despite a more favorable political environment for energy companies.
Short Performance
|
Best Performing Shorts |
|||
|
Name |
Ticker |
Return |
LPF Contribution |
|
Compass Inc (COMP) |
COMP |
-28.06% |
0.13% |
|
Aurora Innovation Inc (AUR) |
AUR |
-22.14% |
0.11% |
|
Newell Brands Inc (NWL) |
NWL |
-12.90% |
0.08% |
COMP fell short of consensus estimates for both revenue and profitability. Meanwhile, Zillow is directly challenging Compass’s off-market listings strategy by implementing a new policy that prohibits homes from listing on Zillow if they weren’t initially posted on the platform within 24 hours.
AUR fell after Uber reduced its stake in the company, and one of the company’s co- founders left for a competitor. NWL fell after disappointing earnings caused by tariff headwinds and weakening consumer discretionary spending.
|
Worst Performing Shorts |
|||
|
Name |
Ticker |
Return |
LPF Contribution |
|
D-Wave Quantum Inc (QBTS) |
QBTS |
92.63% |
-1.06% |
|
IONQ Inc (IONQ) |
IONQ |
94.70% |
-0.58% |
|
Quantum Computing Inc (QUBT) |
QUBT |
139.63% |
-0.53% |
Quantum computing and other speculative growth stocks surged following the tariff delay, but these companies will inevitably face scrutiny as profits are unlikely to materialize in the next several years, if ever.
Portfolio Outlook
The first half of 2025 was so wild that the U.S. dropping bombs on Iranian nuclear facilities hardly even registered. Investors and the Federal Reserve mostly feared extreme tariffs and stagflation. Thankfully, Trump’s tariff war has been more bark than bite.
The reality of 1H25 was that inflation stayed below 3%, and the economy and employment were lukewarm. At this point, a pretty strong argument can be made for at least one more rate cut by the Fed.
A single 25 basis point rate cut by itself isn’t that meaningful, but it could be the spark for a better economy/sentiment. For this reason, we remain fully invested in Select. We have reduced LPF’s net exposure to tame volatility, but it too remains long biased.
Core Long Positions
HAYPP Group AB (HAYPP)
Nicotine pouches, especially newer white snus products like Zyn, are changing how people use nicotine. They’re affecting the use of cigarettes, vapes, and traditional snus or chewing tobacco.
These modern pouches have no known carcinogens and have milder health warnings than other tobacco products. For nicotine users, they’re a natural step forward because they’re safer, easy to use, deliver concentrated nicotine, and absorb quickly. When nicotine pouches enter a market, they’re linked to a drop in the use of more harmful tobacco products such as cigarettes and chewing tobacco.
Haypp Group benefits from this disruption. The company is the world’s largest online distributor of snus and nicotine pouches with 11 e-commerce stores across seven countries in Europe and the US. It also sells nicotine vaping and heat-not-burn products.
Haypp was founded in 2009 as Snusbolaget, initially focusing on online sales of snus in Sweden. The company underwent a strategic transformation when Gavin O’Dowd, formerly of British American Tobacco, joined as CEO in 2017 and shifted the business focus toward nicotine pouches. Haypp Group was formed in 2019 when Snusbolaget merged with Northerner to create the largest online distributor of nicotine pouches.
Nicotine pouch volumes have grown by over 250% since early 2021. The US market grew over 40% in Q1 2025. Nicotine pouches are expected to increase from 5% of global nicotine users in 2024 to 11% in 2030. We believe that the long-term market share will be materially higher than 11%.
In addition to rapid market growth, we expect a gradual shift toward online purchasing as consumers embrace the benefits of enhanced product selection, greater convenience, and superior pricing compared to traditional brick-and-mortar retail. Haypp has articulated a clear “scale economies shared” strategy, leveraging its scale to secure better pricing from manufacturers and pass those savings directly to consumers. The company’s online prices typically run 30-50% below convenience store pricing and 20-40% below grocery store rates. These savings become particularly meaningful given that the average consumer uses half a can daily. This encourages online migration and loyal customers. In 2024, 90% of sales came from returning customers.
In mature markets such as Sweden, online penetration has reached 35% of the total market, while the US currently sits at only 3%.
Haypp has established a powerful competitive advantage in the restricted nicotine products market through two key strengths: regulatory expertise and organic search dominance.
The company operates in a highly regulated space where many competitors cannot compete effectively. Amazon prohibits addictive products entirely, while advertising restrictions prevent other companies from using paid marketing channels.
Haypp overcomes these barriers through age verification for all transactions and strict regulatory compliance, allowing them to operate legally where others cannot.
Beyond regulatory compliance, Haypp has invested heavily in search engine optimization, creating a sustainable competitive advantage. The company generates 97% of its traffic organically, while competitors must rely on restricted paid advertising channels. This organic search dominance provides both cost advantages and market access that competitors struggle to match.
These combined strengths have made Haypp the clear global leader in nicotine product e-commerce. The company holds approximately 85% market share in Nordic countries, 75% in the United States, and 30% across Europe. The operational scale, compliance capabilities, and organic search expertise create a formidable moat that competitors find difficult to breach.
HAYPP currently trades at an enterprise value of SEK 4,500 million while management projects 2028 revenues of SEK 7-9 billion with EBITDA margins of 6-8%, translating to approximately SEK 560 million in EBITDA at the midpoint (implying 8x EV/2028 EBITDA). While we are generally hesitant to value companies based on EBITDA projections 3 years out, we expect growth will be sustained well past 2028. By 2030, HAYPP could be generating annual cash flows approaching its entire current enterprise value. The company is already cash flow positive. Management remains focused on strategic expansion, yet they have committed to returning any excess cash that cannot be efficiently reinvested for healthy returns directly to shareholders.
Business Update
We are pleased to announce the promotion of Andrew Wang to Partner and Co-Portfolio Manager of our funds. Andrew started with Liberty Park as an intern in early 2019 and joined us full time as an analyst in 2022. Liberty Park has had many dozens of interns over the years, and many of those interns had extremely high GPAs and standardized test scores. Andrew, however, not only had a perfect GPA at The University of Texas at Austin and a perfect ACT score, he also exhibited an unusual passion for investing. Our investment in Andrew has paid for itself many times over in the past three years, and we want to formally recognize his contributions and his importance to the team. Please join us in celebrating and welcoming Andrew to the partnership.
GP Capital Flows
In the next three months, the Murphy family office fund, aka LPCM MMXXIV Series of Liberty Park Chorus, will redeem $50,000 of its investment in Liberty Park Select Opportunities as the position has outgrown nearly all others and sizing needs to be brought back to its targeted range. Chuck Murphy (PM) personally will also redeem $50,000 of his investment in Liberty Park Select Opportunities (he added $250,000 in the depths of the 2022 drawdown).
Standard redemption terms will be waived during this time for any other investors who also request liquidity.
Charles P. Murphy, CFA, Managing Partner & Portfolio Manager
Kurt A. Probe, CFA, Partner, Co-Portfolio Manager & Director of Research
Andrew Wang, Partner, Co-Portfolio Manager & Analyst
|
Liberty Park Fund, LP Top 20 Long Positions as of June 30, 2025
LibertyParkSelectOpportunities,LPportfolioasofJune30,2025 Gross exposure 96.53% Wght avg mkt cap $1,434 million Wght avg analysts 5.2 Top 5 names 38.76% (% of AUM) 40.15% (% of invested capital)
DISCLAIMERS This quarterly letter, furnished on a confidential basis to the recipient, does not constitute an offer of any securities or investment advisory services. It is intended exclusively for the use of the person to whom it has been delivered by Liberty Park Fund, LP and it is not to be reproduced or redistributed to any other person without the prior written consent of the Fund. This information has been compiled by Liberty Park Capital Management, LLC and while it has been obtained from sources deemed to be reliable, no guarantee is made with respect to its accuracy. The Fund does not represent that the information herein is accurate, true or complete, makes no warranty, express or implied, regarding the information herein and shall not be liable for any losses, damages, costs or expenses relating to its adequacy, accuracy, truth, completeness or use. This quarterly letter is subject to a more complete description and does not contain all of the information necessary to make an investment decision, including, but not limited to, the risks, fees and investment strategies of the Fund. Any offering is made only pursuant to the relevant private offering memorandum, together with the current financial statements of the Fund, if available, and a relevant subscription application, all of which must be read in their entirety. No offer to purchase interests will be made or accepted prior to receipt by an offeree of these documents and the completion of all appropriate documentation. Liberty Park Fund, LP and Liberty Park Select Opportunities, LP returns are audited; however, all other figures are estimated and unaudited. Net results reflect the net realized and unrealized returns to a limited partner after deduction of all operational expenses (including brokerage commissions), management fees and performance allocations. Performance data assume reinvestment of all distributions. Actual returns will vary from one limited partner to the next in accordance with the terms of the fund’s limited partnership agreement. Past performance is not indicative of future results and investors risk loss of their entire investment. Performance results are shown for the period from March 2011 through June 2025. References in this presentation are made to the Russell 2000 Index for comparative purposes only. Liberty Park Fund, LP and Liberty Park Select Opportunities, LP may be less diversified than the Russell 2000 Index. The Russell 2000 Index may reflect positions that are not within Liberty Park Fund, LP’s investment strategy. Gross Pure Alpha 1 is a metric we use internally to monitor our stock selection performance. Gross Pure Alpha = Gross Return – Leverage Contribution – Beta Contribution. Leverage Contribution = Gross Return – [Gross Return / Average Gross Exposure (when greater than 100%)]. Beta Contribution = Russell 2000 Index Return x Average Net Exposure. Alpha 2 is a Beta-Adjusted Alpha calculation. Alpha = Net Return – (Fund Beta x Russell 2000 Index Return) |
||||||||||||||||||||||||||||||||||||||||||||||||||||||||||||||||||||||||||||||||||||||||||||||||||||||||||||||||||||||||||||||||||||||||||||||||||||||||||||||||||||||||||||||||||||||||||||||||||||||||||||||||||||||||||||||||||||||||||||||||||||||||||||||||||||||||||||||||||||||||||||||||||||||||||||||||||||||||||||||||||||||||||||||||||||||||||||||||||||||||||||||||||||||||||||||||||||||||||||
Original Post
Editor’s Note: The summary bullets for this article were chosen by Seeking Alpha editors.
Read the full article here