Investment Thesis
The Invesco Russell 1000 Dynamic Multifactor ETF (BATS:OMFL) has quickly earned a reputation for being unpredictable. Last year, annual portfolio turnover skyrocketed to 350%, and although I cautioned against this in my April 2023 review of the fund, I’m still surprised at the fund’s extreme fall from grace. Since its launch in November 2017, OMFL has lagged behind the iShares Russell 1000 ETF (IWB) by 7%, completely erasing its 33% lead from April 3, 2023, the date my initial review was published.
Morningstar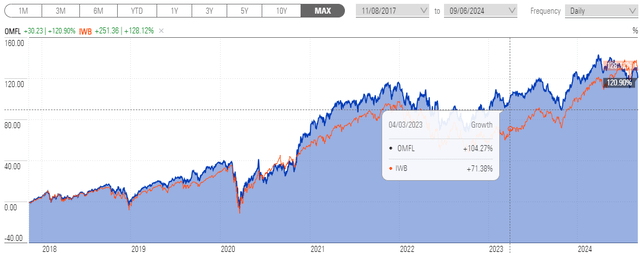
Still, OMFL isn’t destined to fail. September marks the second straight month where its underlying portfolio is on solid footing, and if you’ve managed to hold on for this long, I ask for just a little more patience. OMFL currently ranks well on most factors, and although I can’t make any promises, I’m cautiously optimistic its model has settled on either the “slowdown” or “contraction” phase, meaning its high-quality selections should remain for the near term. I look forward to providing an update on OMFL’s fundamentals below and comparing it with four alternatives you might find more appropriate.
OMFL Overview
OMFL tracks the Russell 1000 Invesco Dynamic Multifactor Index, selecting U.S. stocks based on a proprietary model’s evaluation of the current economic cycle. The indicators evaluated include:
- manufacturing business surveys
- monetary conditions
- housing activity
- equity and fixed-income returns
The output is a determination of the current economic regime: recovery, expansion, slowdown, or contraction. The model then emphasizes certain factors based on this determination, as follows:
Invesco
One important feature is how free the model is to move back and forth between economic cycles. For example, it could determine the economy is in recovery mode one month, expanding the next, and then returning to recovery for the third month. This is not how actual cycles work, and OMFL’s high turnover rates over the last four years illustrate the model’s high sensitivity.
Invesco
Imagine your portfolio manager asked you to overhaul your entire portfolio because they were 51% confident the economic regime changed. Would you follow this advice? I hope not, but OMFL is like that, and it’s the source of the excessive portfolio turnover rates noted above. However, the best I can do is assess OMFL’s current portfolio to identify its strengths and weaknesses and make an educated guess as to how likely it is portfolio turnover will be high moving forward. This analysis might help some readers, but at the same time, I understand readers are probably just fed up with OMFL’s lack of consistency.
OMFL Analysis
The Current Economic Regime
Based on my analysis of OMFL’s current portfolio, I’m confident its model has determined we are in either the slowdown or contraction phase of the economic cycle. I base this on the following:
1. OMFL’s weighted average market cap of $853 billion is slightly more than IWB’s $841 billion. This observation eliminates the recovery and expansion phases as possibilities, as these emphasize the size factor.
2. OMFL trades at 25.78x forward earnings, compared to 22.20x for IWB. This observation also eliminates the recovery and expansion phases, as these emphasize the value factor.
3. OMFL’s sector-adjusted profit score of 9.76/10 is much higher than IWB’s 9.16/10 score. Backed by weighted average net margins that are 1.37% higher (21.44% vs. 20.07%), it’s evident the quality factor is emphasized.
4. OMFL’s five-year beta is currently 0.98 compared to 1.07 for IWB. This lower beta indicates that the model has emphasized the “low volatility” factor, albeit to a limited degree. The slowdown and contraction phases are the two remaining possibilities.
5. Momentum acts as the tiebreaker, but whether the model emphasizes this factor is a bit of a toss-up. To illustrate, consider these statistics based on OMFL and IWB’s current holdings.
The Sunday Investor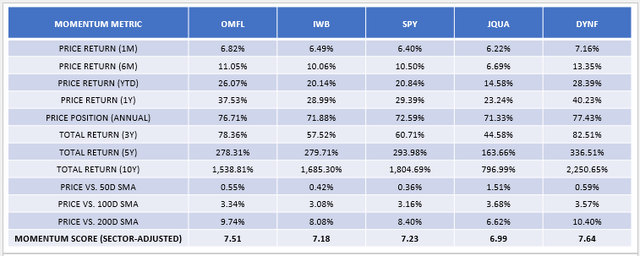
Compared to IWB, OMFL’s constituents have weaker longer-term results (e.g., five- and ten-year total returns) but better short-term results, like a one-year price return that’s 8.54% more (37.53% vs. 28.99%). OMFL’s short-term momentum features also look better than the SPDR S&P 500 ETF Trust (SPY) and the JPMorgan U.S. Quality Factor ETF (JQUA), and since its model relies on more recent price movements, I’m inclined to believe OMFL’s model has emphasized this factor. Therefore, the model has likely determined we are in the contraction phase, though a slowdown is possible.
That would mostly agree with the assessment from The Conference Board, the nonprofit organization that produces the widely popular Consumer Confidence Survey. The latest survey indicates consumers have labor market concerns, while the Conference Board expects GDP growth to slow in 2024, writing in its August 2024 brief:
Recent financial market gyrations notwithstanding, the US is likely not on the cusp of recession. Nonetheless, the economy is expected to lose momentum in H2 2024 as high prices and elevated interest rates sap domestic demand. Real GDP growth rose by an unexpected 2.8 percent quarterly annualized in Q2 2024. But there were some signs of weakness, especially as consumers dialed back on services spending, which has been a key contributor to real GDP growth over the last two years. Consumers and businesses are likely to continue cutting spending and investments ahead, suggesting economic growth decelerated to 0.6 percent annualized in Q3 2024.
Can Things Change?
It’s possible the model will switch to the expansion phase regime it adopted in early July, and while I think it’s unlikely, the potential impact is considerable. This switch would cause OMFL to select volatile small-cap value stocks that have significantly underperformed over the last decade. As shown below, the small-cap value asset class lagged behind SPY by 12.65% in 2020 and trailed by 7-10% per year in 2017, 2018, 2019, 2023, and 2024 YTD.
Portfolio Visualizer
Total returns aside, the asset class is also quite risky. Over the last 20 years, small-cap value stocks were about 30% more volatile than S&P 500 Index stocks based on the percentage difference in annualized standard deviation figures (19.68% vs. 15.03%). Importantly, the added risk was not beneficial. The asset class had only a 0.62 Sortino Ratio, a common measure of downside risk-adjusted returns, compared to 0.90 for SPY.
Portfolio Visualizer
OMFL Fundamentals By Top 25 Holdings
The following table highlights selected fundamental metrics for OMFL’s top 25 holdings, which total 64.01% of the portfolio. At the bottom are summary metrics for IWB, SPY, JQUA, and the BlackRock U.S. Equity Factor Rotation ETF (DYNF). DYNF also emphasizes specific factors (quality, value, size, volatility, momentum), so it will be interesting to see if the two models agree.
The Sunday Investor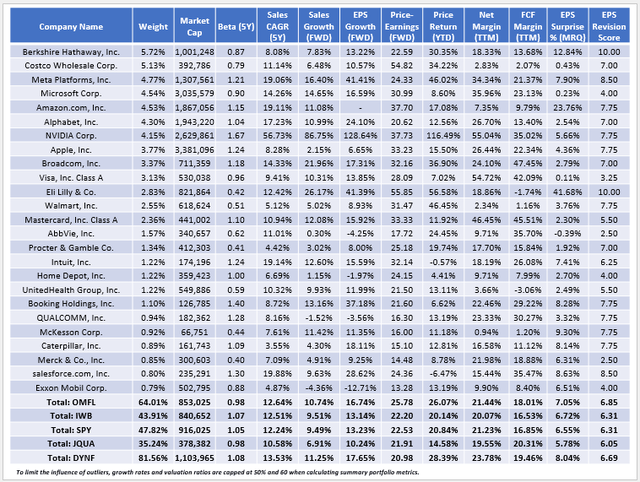
OMFL is a high-quality fund, and the portfolio also offers excellent one-year estimated sales and earnings growth of 10.74% and 16.74%, respectively. Compared to IWB, this growth is driven by overweighting stocks like Meta Platforms (META) and Eli Lilly (LLY) by 2.53% and 1.29% and underweighting Apple (AAPL) by 2.63%. However, I caution that quality and growth come at a significant price. OMFL trades at 25.78x forward earnings, which is 3-3.5 points more expensive than IWB and SPY. At 21.91x forward earnings, 10.24% estimated earnings growth, and a 0.98 five-year beta, JQUA is more suited for value-leaning quality investors, while DYNF seems to have it all. Its growth and value metrics are excellent, and its constituents’ net and free cash flow margins are terrific, but the catch is its poor diversification. DYNF allocates 81.56% of its portfolio to just 25 stocks, with heavy allocations to just two sectors: Financials and Technology.
The Sunday Investor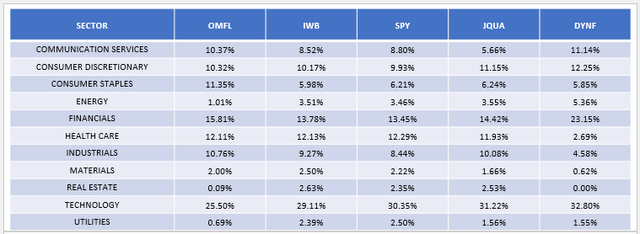
Lastly, I want to highlight OMFL’s excellent earnings momentum features. Top holdings like Berkshire Hathaway (BRK.B), Meta Platforms, and Amazon (AMZN) have high EPS Revision Scores, which I derived from Seeking Alpha Factor Grades. OMFL’s overall 6.85/10 score ranks #37/661 among all the Size & Style ETFs I track, and it complements a solid 7.51/10 Momentum Score that ranks #63/661. These scores should align, as the last thing you want is to buy a group of stocks with excellent price momentum but low or negative earnings revisions. Fortunately, I don’t see that risk with OMFL.
Investment Recommendation
OMFL is not appropriate for most investors. Its model is unpredictable and shifts frequently between economic regimes that emphasize entirely different factors, leading to excessive turnover. However, I’m optimistic the model will settle into the slowdown or contraction phases where it favors quality, low volatility, and possibly momentum. Although costly from a value perspective, this setup results in a well-diversified portfolio of less-volatile large-cap stocks with excellent earnings momentum. Still, OMFL could change holdings again, and since I don’t have insights into its model’s current confidence level, I suggest proceeding cautiously or avoiding it altogether. Therefore, I’ve assigned only a “hold” rating to OMFL, and I look forward to answering any questions you might have in the comments below. Thank you for reading.
Read the full article here


