To the Shareholders of Pershing Square Holdings, Ltd.:
In 2023, Pershing Square’s 20th year, Pershing Square Holdings (OTCPK:PSHZF) generated strong NAV performance of 26.7% versus 26.3% for our principal benchmark, the S&P 500 index.6 Our total shareholder return was 36.0%, as PSH’s discount to NAV narrowed by 4.5 percentage points from 33.2% to 28.7%.7
Investors who invested in Pershing Square, L.P. at its inception on January 1, 2004, and transferred their capital account to PSH at its inception on December 31, 2012 (“Day One Investors”) have grown their equity investment at a 16.5% compounded annual rate over the last 20 years, compared with a 10.0% return had they invested in the S&P 500 during the same period.
With the magic of compounding, our 16.5% compound annual NAV return translates into a cumulative total NAV return since inception of 2,078% versus 592% for the S&P 500 over the same period. In other words, Day One Investors have multiplied their equity investment by 22 times versus the seven times multiple they would have achieved had they invested in a zero-fee S&P 500 index fund.8
Using PSH’s stock price return rather than per-share NAV performance, Day One Investors have earned a 15.0% compounded return, a 17-times multiple of their original investment.9 This lower return reflects the 26.3% discount to NAV at which PSH’s stock currently trades.10 Our strong preference is for PSH’s shares to trade at or around intrinsic value for which we believe NAV per share is a conservative estimate. We recently announced a number of important steps that we believe will help to close the discount to NAV, which I discuss later in this letter.
2023 In Review
2023 was another excellent year for our portfolio companies and their stock price performances. Despite a challenging geopolitical backdrop with two major wars underway and a large and sustained increase in interest rates, our portfolio companies continued to generate strong growth in revenues, profits, and shareholder value. This outcome is not guaranteed every year, but it is certainly intentional. We seek to identify businesses whose business models, competitive advantages, barriers to entry, balance sheets, and excellent management teams enable them to succeed despite the negative extrinsic factors (i.e., factors that are not inherent to the business itself) that inevitably emerge.
We added one company to the portfolio in 2023, Alphabet (aka Google (GOOG,GOOGL)), and we exited one, Lowe’s (LOW). Our limited portfolio activity should not be a surprise. In that we are a long-term investor which attempts to identify businesses we can own for a decade or more, you should generally expect limited changes in our equity portfolio composition. Frenetic investment activity is often the enemy of long-term performance. An investment manager who markets itself as a long-term owner of businesses, but who is constantly buying and selling new securities is likely misrepresenting their strategy.
Hedging and Asymmetric Investments
We seek to mitigate extrinsic risks by investing in hedges and other asymmetric instruments that offer large payoffs if negative events occur. While we have successfully hedged the three ‘black swan’ risks of the last 20 years of our history – the Great Financial Crisis, Covid 19, and the Federal Reserve’s recent aggressive increases in short-term rates – we can’t promise to identify and execute attractive hedges for all future risks. We do, however, spend significant time attempting to understand the potential risks that may emerge in the world, and the various instruments we can use to ‘insure’ against their potential negative effects. In order for our hedging strategy to be effective, we need to both identify the potential risk and invest in an instrument that offers a sufficient payoff relative to the cost of the hedge. Our ability to have done so historically is due to the fact that we have identified important risks in advance of most other investors. Our hedging strategy has been a substantial contributor to our long-term performance as we have generated large profits from these investments and we have generally reinvested the proceeds in our core holdings at lower valuations during market disruptions.11
In 2023, our hedges generated 187 basis points (bps) of losses principally due to an energy-related hedge (-108bps) and Japanese interest-rate swaptions (-141bps) offset somewhat by mark-to-market gains on USD interest-rate swaptions (+92bps) referencing several tenors (30-year payer swaptions, and 5-year and 1-year receiver swaptions).12 Our 30-year USD interest-rate payer swaptions (instruments that increase in value as rates rise) were valued at 92% above cost at the beginning of the year, but we did not realize these gains because of continuing concerns we had for most of the year about rising interest rates.
In October, we believed that interest rates were unlikely to rise further and we sold our 30-year USD interest-rate swaptions and generated a smaller profit (33% premium above cost). We then initiated investments in 1-year and 5-year instruments that increase in value as rates decline, which we continue to hold.
We also continue to maintain our energy-related hedge to mitigate the impact of a large rise in energy prices. As energy prices decreased in 2023, the hedge’s value declined to about 39% below cost at year end and has increased in value since the beginning of the year with the rise in energy prices.
Our hedging program has enabled to us to be comfortable remaining fully invested even during periods of market turmoil. Our approach to portfolio management, however, may cause us to maintain a profitable hedge longer than would be optimal if our only concern were maximizing the profit on the hedge. We do so because our goal is to generate overall portfolio gains rather than maximizing the profits of individual hedges. If one purchased a large homeowner’s policy, one should be similarly reluctant to cancel it in exchange for a substantial payment from the carrier if a large tornado were enroute. Alternatively, if we managed a separate fund just for asymmetric bets, the fund’s mandate would only consider the profit maximization of its asymmetric instruments, not protecting a long equity portfolio from the risk of loss.
Our principal goal in initiating and maintaining hedges is to reduce the overall risk of a permanent loss of capital, and to create liquidity at times when liquidity is most valuable. Our investment in credit default swaps on the investment grade bond index to hedge Covid risk in late February and early March of 2020 best exemplifies this strategy. In March of 2020, the Pershing Square Funds generated $2.6 billion of proceeds from an investment of $27 million of CDS premium and quickly redeployed $2.3 billion of these profits in a stock market that had declined by as much as 33.8%.13 2020’s hedging and reinvestment program led to our best performance year ever, up 70.2% in 2020.
While our investments in hedging and asymmetric instruments have been enormously profitable, we could have done better. In each of the three black swan events of the last 20 years, we had an early and highly variant view of the likely impact and probability of their occurrence and had identified and invested in instruments that offered profits many times their cost. In retrospect, we should have invested more and achieved even greater profits without risking materially more capital.
While our strategy of identifying asymmetric investments has existed since the inception of Pershing Square, it could be best described as episodic and opportunistic. After our successful Covid trade in early 2020, we have adopted a more systematic and dedicated approach executed by a subset of the investment team – Ryan Israel, Bharath Alamanda, and myself. Our experience with our new dedicated effort has been favorable. We have broadened the universe of asymmetric opportunities we are researching and are finding a greater number of interesting opportunities to pursue. While we intend for these investments to continue to represent a modest percentage of our capital, we believe they could be an even more important contributor to our returns over time.
Our 20-Year Performance History
Pershing Square’s performance history can be best understood by considering it in three chapters. In our first chapter, we generated a 20.9% compounded return for the first nearly 12 years of our history – from January 1, 2004 to July 31, 2015.14 In chapter two, which lasted about two years, we incurred a large loss on our investment in Valeant which led to declines both in the market value of our other long positions and an increase in the liability of our short position in Herbalife as its stock price rose as investors expected us to be forced to sell and/or cover positions. Our recovery began in 2018 as we generated a nearly flat year (-0.7%) in a down market.
At the inception of chapter three, which began in 2018, we announced that: (1) we would no longer seek to raise capital for our two open-ended funds – Pershing Square, L.P. and Pershing Square International, Ltd., (2) we would return to our roots as an “investment-centric” operation, and (3) we would refocus on our core investment principles, which we symbolically engraved on ‘stone’ tablets that sit on everyone’s desk and in conference rooms around the office.
We also gave up activist short selling (which had been a very small but publicly notable part of our strategy) and I and other employees and affiliates made a large additional investment in PSH, which greatly increased the stability of our capital.
In segment three, we have generated our best absolute and relative NAV returns since inception, 25.3% compounded for the last six calendar years, 1,320 basis points per annum above the S&P 500’s total return over the same period. What has caused our outperformance? We believe the answer can be best understood by examining the competitive advantages that we have developed over time.
The Sources of Pershing Square’s Competitive Advantage
Michael Porter, the Harvard Business School professor and competitive strategy guru, has been one of the most important influences on our investment strategy. Michael was an early investor in Gotham Partners, my first fund, and in Pershing Square where he served on our advisory board for nearly two decades. Michael retired from HBS recently, but his work continues to drive enormous value in business, government, and society for which we should all be very grateful. Michael will soon be honored in a full day symposium at HBS later this month which makes it timely for us to examine Pershing Square’s competitive advantages so that we can better understand their importance in contributing to our historic profits and in helping to drive our long-term prospects.
The Competitive Advantages of Our Investment Strategy
Pershing Square’s competitive advantages begin with our investment strategy which has few likeminded practitioners. Our strategy is to acquire large minority stakes in the highest quality, durable growth companies in the world, generally at times when a company is enduring a period of underperformance, or alternatively when the market incorrectly believes that a period of subpar performance for a business is about to begin. Because of our track record for successfully effecting positive corporate change, we are able to obtain a large degree of influence over the companies in which we invest. Our influence enables us to have input into and advise on management, governance, and/or strategic issues, thereby assisting our portfolio companies in creating long-term value.
It has been nearly eight years since we have made a so-called “activist” investment. In our early years, we had not yet earned sufficient credibility in the board room to obtain corporate influence, so we had no choice but to utilize an activist approach. Over the last 20 years, we have built substantial credibility with management teams, boards of directors, and shareholders that has enabled us to avoid the need for activism to have influence in the board room. We greatly prefer our quieter and more time-efficient approach to engaged long-term ownership.
One can think of our strategy as akin to private equity, but where we do not need to pay a premium for control in an auction managed by a first-tier investment bank, and therefore, unlike private equity, we don’t need to use large amounts of leverage to generate attractive rates of return. Our investment universe is also not limited to what is for sale in the private markets. Our opportunity set is comprised of large capitalization, publicly traded companies which include many of the best businesses in the world that would not likely be receptive to a going private transaction.
Our strategy of investment concentration is an important competitive advantage as we allocate capital only to our best ideas. Fewer investment professionals are needed to manage a concentrated portfolio. Our small team approach allows us to recruit the best and brightest as top talent greatly prefers to be one of eight or 10 investment professionals rather than one of 25, one of 100, or even 1,000 or more, team sizes which are common at other large alternative investment managers.
Our investment strategy is one of the few that benefits from economies of scale. In light of our long-term ownership objectives and the large cap nature of our targets, larger ownership stakes are beneficial as they increase our influence, which helps to drive our investment performance. While we have yet to legally control a business with a 50% or greater stake, one can envision a world where we do as our asset base grows over time.
The Competitive Advantages of Permanent Capital
Pershing Square is one of only a few investment managers that operates with permanent capital. In a world where our competition is beholden to annual, quarterly, monthly and even daily redemption terms, the stability of our capital base is one of our most important competitive advantages. It enables us to take the long view and to be opportunistic during market panics, a time when other investors typically need to raise capital by selling assets to meet the redemptions that inevitably come with market volatility. Permanent capital also allows us to make long-term commitments to management teams which have enabled us to recruit some of the most outstanding CEOs in the world to our portfolio companies.
Our closed-ended fund structure, strong long-term performance record, and portfolio comprised of well-capitalized large companies have enabled PSH to garner strong investment grade credit ratings and to issue a modest amount (generally between 15% and 20% of total assets) of investment grade bond financing without mark-to-market or other margin-like covenants. This low-cost, long-term leverage (3.1% weighted average cost of capital, eight-year weighted-average term bonds) replaces higher-cost equity capital and enhances our long-term investment returns, without adding meaningful risk to the portfolio.
Permanent capital is an important recruiting tool. We generally hire investment analysts from the top private equity firms. The risk of leaving a large established private equity firm for a position at a typical hedge fund is that one’s tenure is highly correlated with the short-term success of the firm the analyst joins regardless of his or her individual performance. In light of our permanent capital base, even in the most challenging period in our history in 2017, we were able to recruit the top two investment professionals of the private equity class of that year. Bharath Alamanda and Feroz Qayyum joined when we were well below the high-water mark because they understood that our permanent capital base provided long-term staying power.
Permanent capital is also a great retention tool. Whereas in the past, a few members of our investment team left to form their own firms, none have departed since we restructured the firm six or so years ago. While an entrepreneurial analyst could still leave and launch her own firm, she would be leaving behind the benefits of our permanent capital, large scale, and our reputational equity.
The Competitive Advantages of the Pershing Square Brand
While there are a number of other well-known hedge fund firms, in most firms the brand is not relevant to their investment performance. We have increasingly found that the Pershing Square brand, or in other words, the reputational equity that we have built over time, is an important asset of the firm. We are well known for our tenacity, for keeping our word, and for doing the right thing. These tenets of our corporate ethos have also enabled us to attract and retain the best talent to our firm and to the companies that we own, while also creating opportunities for investment. Our 2021 negotiated investment in Universal Music Group was facilitated by the reputation that we have built over 20 years. Our reputation is our most carefully guarded asset, one that we expect will play an even more important role in our longer-term investment performance.
The Competitive Advantages of Admitting Our Mistakes and Learning from Them
Experience is making mistakes and learning from them. We have made many mistakes over 20 years, and we treasure each and every one of them. We write about our mistakes in our public letters. We talk about them in podcasts and interviews, and they are widely featured in the media. We are transparent about our errors for two reasons: our investors are entitled to as much transparency about our failures as our successes, and importantly, our public disclosure of mistakes encourages us to study and learn from them, markedly decreasing the likelihood that they will be repeated.
The Competitive Advantages of Our Culture and Small Organizational Scale
Pershing Square has 40 employees. The combination of permanent capital and a concentrated investment approach allows us to operate with substantially fewer employees compared with firms with similar amounts of capital under management. Our smaller human scale allows us to attract the highest quality employees and retain them. Our unique family-oriented culture, the powerful economics of our business, and its widely dispersed economic ownership make Pershing Square a unique and special place to spend one’s career. Our small scale and long-tenured employee base also reduce risks, particularly in a regulatorily-sensitive industry.
Much has been said about the DEI movement on campus, corporations, and in government in recent months. Pershing Square manages to be a highly diverse, meritocratic, and inclusive culture for all of our employees. While we have long believed in the benefits of our diverse culture, Pershing Square’s diversity is not just defined by our racial, ethnic, sexual identity, and gender differences. Our team members come from highly diverse geographical, socioeconomic, and cultural backgrounds and represent broad viewpoints, politically and otherwise. Yet, we all manage to get along well without the corporate politics typical of many companies. While we don’t all agree on who should be our next U.S. president, we are closely aligned on our long-term mission of driving value for our investors. We are extremely fortunate to work alongside such a remarkable, high- quality group of human beings.
Other Notable Developments of 2023 Pershing Square SPARC Holdings, Ltd.
After two years and 15 amended filings of its registration statement, Pershing Square SPARC Holdings, Ltd. was finally declared effective by the SEC on September 29, 2023. To remind you, SPARC is a new form of acquisition company that does not suffer from the structural, compensation, and other problems with other acquisition vehicles. SPARC has no underwriting fees, shareholder warrants or founder stock, nor is there a short timeframe to identify a transaction (we have 10 years to execute a deal).
We believe that SPARC is the most efficient and certain way for a private business to go public, with the benefit of Pershing Square as an anchor investor with as much as a $3.5 billion committed investment, a commitment that we can make prior to the public announcement of the transaction.15 As a result, a potential counterparty can have certainty about its public offering including price (i.e., valuation) and the minimum amount of capital that will be raised regardless of market conditions.
We have received a substantial number of inbound potential SPARC transaction ideas, but none yet that meet our standards for business quality, durable growth, and sufficient scale. We welcome ideas for potential transactions and would be delighted to pay advisors for bringing us a deal that meets our criteria.
Modifications to the Investment Management Agreement
On February 7th, PSH announced certain amendments to the Investment Management Agreement that will have the effect of reducing PSH’s 16% performance fee. The amendments to the IMA include:
- An amendment to the Variable Performance Fee (“VPF”) provision of the IMA which will now provide that the Additional Reduction will no longer exclude fees paid to the Investment Manager by Pershing Square funds that are publicly traded in the United States.
- An amendment to the VPF provision of the IMA which provides that the Additional Reduction will also include an amount equal to 20% of any management fees that the Investment Manager earns from non-PSH, Pershing Square funds that invest in public securities that do not have performance fees.
- The waiver by the Investment Manager of the right to receive the $36 million outstanding balance of unrecovered IPO costs before the Additional Reduction under the VPF provision takes effect.
As a result of the above amendments, PSH’s 16% annual performance fee will now also be reduced by 20% of any management fees earned from any non-PSH Pershing Square funds that invest in public securities and do not have performance fees. The benefits of reduced fees include better long-term performance and, we also believe, greater demand for shares from investment managers who are required to report the ‘look-through’ fees of funds in which they invest. We believe the Key Information Document (“KID”), which requires disclosure of the proportion of fees and (illogically) the interest expense of any fund an asset manager invests in – is one of the principal factors driving reduced demand for PSH, thereby contributing to our wider discount to NAV. By reducing PSH’s performance fees, we will generate higher returns, report lower fees on our KID disclosure document, and PSH will become a more attractive investment for all.
On February 7th, we also announced our intention to launch a U.S. closed-ended fund called Pershing Square USA, Ltd., a fund which will largely mirror PSH in its investment strategy and hedging and asymmetric investment approach.
With the benefit of the newly modified VPF arrangement, our long-term goal is to reduce PSH’s performance fees to zero with the launch of new funds and strong long-term performance. We are limited in what we can share about these plans due to regulatory reasons, but we will inform you as promptly as possible about these developments.
Our CEOs
Over the last 20 years, we have had the opportunity to work alongside some of the greatest CEOs in history. Notable mentions from our past include icons such as Hunter Harrison of Canadian Pacific and Seifi Ghasemi of Air Products, and our current roster is similarly extraordinary. We would not have achieved our success without their transformative contributions. While we always sing our CEOs’ praises internally and often in our letters, it is important that you know how fortunate we are to have the benefit of their acumen, commitment, energy, and alignment with our success.
Our Academy Award winners this year include:
Keith Creel of Canadian Pacific (the best operator in the industry who created the first Trans-North American railroad with the completion of the acquisition of Kansas City Southern in December 2021),
Patrick Doyle, Executive Chairman of Restaurant Brands (best known for his remarkable success at Domino’s who along with CEO Josh Kobza we expect will deliver an even better outcome at RBI),
Marvin Ellison of Lowe’s (who has executed a brilliant turnaround on a rapid path to catch Lowe’s direct competitor),
Sir Lucian Grainge of UMG (who has navigated every music format and technological threat to the industry with aplomb and can only be described as an icon),
Brian Niccol of Chipotle (Chipotle stock is up more than 10-fold since Brian became CEO in March 2018. What more can we say?),
Chris Nassetta of Hilton for whom words do not do justice,
Sundar Pichai of Alphabet (whom we don’t yet know, but has led Alphabet for over the last eight years, during which the company’s revenue, earnings and market value have grown substantially), and
David O’Reilly of Howard Hughes Holdings (who has not yet reached iconic status but is on his way based on his progress to date).
Last, but not least, it is important to mention the CEOs of Fannie Mae and Freddie Mac, Priscilla Almodovar and Michael DeVito, whom we have never met, get no recognition, and are underpaid because both companies remain wards of the state. These two executives run two of the most important companies in the country, critical for our unique housing finance system to remain intact, and one of the most important drivers of our economy. We should all be incredibly appreciative for their important work on our nation’s behalf.
While the CEOs get most of the shoutouts, the rest of the team members ultimately do the work required to deliver the results. Thank you to all for an incredible 20 years.
2023 was yet another year of geopolitical and economic uncertainty. 2024 will likely be no different with the upcoming U.S. presidential election, unresolved wars in Ukraine and the Middle East, and continued political disharmony globally. Despite these concerns, we believe we are well equipped for uncertainty in light of the high-quality nature of the businesses we own, and the superb management teams that preside over them. Volatility is the friend of the long-term investor with permanent capital. While we fret about the world around us, we are well positioned for uncertainty.
There are few firms in our industry who make it past a decade, let alone more than 20 years. We are incredibly grateful for the opportunity you have given us to be a long-term steward of your investment capital. Thank you for your confidence and support.
Sincerely,
William A. Ackman
PORTFOLIO UPDATE16
Performance Attribution
Below are the contributors and detractors to gross performance of the portfolio of the Company for 2023 and year-to-date 2024.17
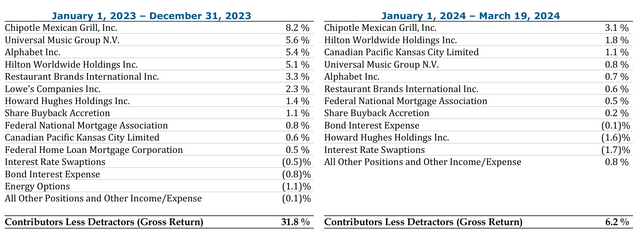
| Contributors or detractors to performance of 50 basis points or more are listed above separately, while contributors or detractors to performance of less than 50 basis points are aggregated, except for bond interest expense and share buyback accretion. Past performance is not a guarantee of future results. All investments involve risk, including the loss of principal. Please see accompanying endnotes and important disclaimers on pages 121-125. |
Current Equity Positions:
Universal Music Group (OTCPK:UMGNF, “UMG”)
Universal Music Group is the world’s leading music entertainment company and a high-quality, capital-light business that can be best thought of as a rapidly growing royalty on greater global consumption and monetization of music. In 2023, UMG’s organic revenues grew 12% while Adjusted EBITDA grew 19%, far in excess of the company’s mid-term guidance. We generally prefer to follow the progress of an earnings-per-share driven metric of bottom-line financial performance rather than adjusted EBITDA when evaluating businesses. For 2023, however, UMG’s Adjusted EBITDA is a reasonable method to judge the company’s year-on-year progress in light of the large upfront option-grant expenses in 2023, a substantial portion of which are one-time in nature. We believe that the long-term outlook for UMG is strong and that the company will continue to outperform its mid-term guidance due to better monetization, cost rationalization, and continued development of new services.
We have long believed that music is one of the lowest-cost, highest-value forms of entertainment, which is still in the early stages of monetization. Up until recently, the ~$10 per month pricing of music subscriptions has remained unchanged. In 2023, each of the major digital service providers (“DSPs”) increased prices for individual subscriptions from $9.99 to $10.99, and Deezer, a smaller player, increased prices further to $11.99 in its key markets. Because of the lag between announcement and pricing implementation, these increases only partially contributed to 2023 revenues, and 2024 will be the first full year to benefit from price increases. We believe that regular price increases will become the norm in the audio streaming industry as they are in the video streaming industry.
Importantly, UMG is also helping shape the industry by moving it towards an “artist-centric” economic model which would provide greater rewards to those artists who drive subscriber growth, engagement, and retention. UMG has signed agreements with most of the major DSPs that incorporate these principles which will increase artist revenues, and the labels including UMG which represent them.
While streaming led to broad adoption among consumers, a single price point for all consumers has not allowed for customer segmentation. We believe engaging and monetizing superfans through targeted offerings is a significant opportunity for platforms and labels. UMG is actively working with its partners to expand the music market by offering products and experiences for superfans. The company will update investors on these initiatives and its growth outlook at its Capital Markets Day in September.
While UMG’s revenues and business performance have been ahead of our expectations and the company’s mid-term targets, its costs have also grown meaningfully over the last few years. The company recently announced a €250 million cost-saving program, far above investor expectations. We believe these savings will allow the company to reliably expand its margins while still maintaining industry-leading A&R (artist and repertoire) and marketing investments. The company also announced a minority investment in Chord Music Partners, an investment vehicle for smaller catalog acquisitions. The partnership is a financially attractive way for UMG to acquire certain catalog assets on attractive terms while earning distribution and other fees for its services.
While investors were initially concerned about the impact of artificial intelligence (“AI”) on the music industry, UMG is demonstrating its ability to harness AI’s growth opportunities while also ensuring regulatory and legal protection for its artists. In August, UMG and Google announced joint ethical AI principles and YouTube released AI music tools including a prompt-based feature that generates content in an artist’s voice. UMG is also lobbying lawmakers to protect artist rights. U.S. lawmakers are considering a federal right of publicity law and bolstering existing copyright law. European lawmakers recently passed the EU Artificial Intelligence Act, which includes meaningful transparency and record keeping obligations.
While UMG is actively partnering and enabling the ethical use of AI, it is also taking a strong stance against platforms that have trained their models on copyrighted content by challenging them in court.
Alphabet (GOOG,GOOGL)
In early 2023, we initiated an investment in Alphabet, the parent company of Google, at a highly attractive valuation during a period when apprehension about the company’s competitive positioning in AI overshadowed the high-quality nature of its business and strong growth prospects.
Since we initiated our position, the company has delivered impressive operating results. With two of the highest ROI and most resilient ad formats in Search and YouTube, Google occupies a dominant position in the secularly fast-growing digital advertising market. As the digital advertising market recovered over the course of the year, revenue growth in Google’s advertising business accelerated from 3% in Q1 2023 to 10% in Q4 2023. Moreover, the company realized significant progress on its substantial margin expansion opportunity and maintained a robust capital return program. In 2023, operating profit margins expanded by approximately 225 basis points (bps), excluding one-time severance and real estate charges, as the Cloud segment reached breakeven profitability. We expect continued cost control, automation efficiencies, and operating leverage in under-earning segments (Cloud & YouTube) to sustain margin expansion as Google invests behind AI initiatives.
The company is using its ample free cash flow to repurchase approximately 4% of its outstanding shares on an annual basis.
Despite strong financial performance, concerns about Google’s AI capabilities continue to weigh on its valuation. These concerns were recently stoked by Google’s flawed rollout of its Gemini chatbot app which displayed historically inaccurate and biased responses to certain image and text queries. CEO, Sundar Pichai, has acknowledged these responses as “completely unacceptable” and the company is working quickly to rectify underlying issues, including implementing structural changes to its product launch, evaluation, and red-teaming processes to prevent future instances of bias. While Google’s challenges have been well-publicized, it is worth noting that AI chatbots from other Big Tech and upstart competitors have displayed similarly biased and inaccurate responses.
We are still in the very early days of AI commercialization and expect the company to iterate and learn from occasional missteps as it launches new AI applications. Over the longer term, we believe Google’s access to high-quality training data, its substantial distribution moat, its AI-optimized infrastructure and deep technical expertise are durable competitive advantages. Although overshadowed by the scrutiny around its chatbot, Google also recently unveiled its next-generation AI model, Gemini 1.5, which we believe is industry-leading and represents a step-change improvement in the amount of information an AI model can process. For example, Gemini 1.5 is capable of analyzing hour-long videos and codebases with over 30,000 lines of code. Google is uniquely well-positioned to deliver AI advances, like Gemini 1.5, cost-efficiently and at scale across its broad suite of consumer and Cloud apps, including six different products that each serve more than two billion users.
The cumulative impact of AI and machine learning enhancements is perhaps most evident in Google’s core Search franchise. Google Search has evolved from its starting point as a simple results page with “10 blue links” and now provides summary answer snippets for informational and educational queries similar to AI chatbots without any of their latency. For more involved queries, for example, in travel, the company has developed specialized Google Flights and Hotels modules that offer consumers substantial utility and freedom to direct their discovery process. Innovation in Google Search has maintained its leading market position through multiple perceived “disruption” risks over time, including the platform transition from desktop-to-mobile and competitive threats from social media and verticalized search. Likewise, we view the company’s integration of generative AI into a wider range of queries, not as a disruptive shift, but as a natural evolution of its Search product which will enhance the user experience and improve conversion for advertisers.
We continue to believe Google is one of the most advantaged and scaled players in AI with an unmatched business model. The company’s stock currently trades at approximately 19 times forward earnings, a deep discount to its peers despite its similar rate of projected earnings growth.
Chipotle (CMG)
Chipotle delivered outstanding results in 2023 driven by the company’s continued focus on exceptional food and operational excellence. Same-store sales grew 8% in 2023, or 42% from 2019 levels. Traffic growth accelerated from 4% in the first quarter to more than 7% in the fourth quarter as customers responded to Chipotle’s industry-leading value proposition, faster throughput, and successful menu innovations including its Chicken Al Pastor and Carne Asada limited time offerings. Customer feedback shows that Chipotle’s offering is closely aligned with how today’s consumer wants to eat, while serving higher quality food than its fast casual competitors at 20-30% lower prices.
Chipotle’s robust sales growth and attractive unit economics resulted in 230bps of restaurant-level margin expansion in 2023. While management made encouraging progress during the year, it still sees significant opportunity to improve in-restaurant execution, which should further increase profitability and enhance the customer experience in the near term.
We believe Chipotle is in the early innings of a decades-long growth story. In North America, management expects to grow its restaurant count at a rate of 8% to 10% per annum, with the goal of more than doubling its store base to at least 7,000 locations. International expansion remains a largely untapped opportunity, with the company just beginning to increase investment in Europe and recently announcing its first-ever franchise agreement in the Middle East. In addition to opening new restaurants, Chipotle’s many growth opportunities in existing restaurants include menu innovations, loyalty program enhancements, and the long-term potential to offer breakfast and leverage automation technology to simplify operations.
Restaurant Brands (QSR)
QSR’s franchised business model is a high-quality, capital-light, growing annuity that generates high-margin brand royalty fees from its four leading brands: Burger King, Tim Hortons, Popeyes, and Firehouse Subs. Since Patrick Doyle joined as Executive Chairman in November 2022, QSR has announced various strategic initiatives and begun providing investors with more details about the business. Coupled with significant investments over the last few years to drive more consistent growth across each of its brands, QSR has entered a new era of what we believe will be consistently stronger performance.
In February, the company hosted an investor day and introduced a five-year growth outlook comprising 3%+ annual comparable sales and 5%+ net restaurant growth, driving 8%+ system-wide sales and operating income growth. We believe the company can outperform these targets, as expenses will grow slower than sales while it laps its investments at Burger King in the U.S. The company also updated investors on franchisee profitability with significant improvements at each of its brands, including nearly 50% increases in franchise profitability at Burger King in the U.S. and 30% at Tim Hortons in Canada.
Burger King’s turnaround in the U.S. is well underway and is now poised for acceleration. Comparable sales in the U.S. improved each quarter during the year despite the majority of the $400 million “Reclaim the Flame” program yet to be spent. To further accelerate the turnaround, the company announced plans to acquire its largest franchisee, Carrols, with the goal of fully modernizing and refranchising its restaurants over the next five to seven years. We believe these substantial investments will transform the majority of Burger King’s restaurants to their modern image and help shift the franchise system towards smaller more entrepreneurial operators, setting the brand up for long-term success.
The company also revised its segment reporting and began providing standalone financials for its international business. In our view, this is the crown jewel of the company, as it is a pure franchised royalty business, with a decades-long opportunity for unit growth. In 2023, QSR’s international business generated systemwide sales growth of 18% and operating income growth of 15%, despite temporary weakness in some markets. The international business comprises nearly half of QSR’s restaurants and nearly a third of its operating income, a strong source of long-term growth and profitability for the company.
Despite economic weakness in China, we expect unit growth will be higher in 2024 than 2023 and will eventually return to the company’s historic 5%+ growth rate. While QSR has made substantial progress across its brands, it still trades at a discount to its intrinsic value and its peers, which have lower long-term growth potential.
Hilton (HLT)
Hilton is a high-quality, asset-light, high-margin business with significant long-term growth potential. Hilton generated strong financial performance in 2023 as revenue per available room (“RevPAR”), the industry metric for same-store sales, increased 13% year over year reflecting both the continued late-cycle international recovery from COVID-related industrywide disruption and strong domestic trends. Earnings-per-share grew 27% year over year, and are now ~60% above pre-COVID-19 levels reflecting the compounded benefit of Hilton’s net unit growth, excellent cost control, and share buybacks.
Near-term industry trends remain favorable, which will continue to benefit from continued robust RevPAR growth balanced across still improving occupancy trends and continued strength in average daily room rate (“ADR”). While aggregate occupancy remains modestly below pre-COVID levels, it is poised to improve in 2024 driven by acceleration in business transient travel, record group demand, and strong international growth. Similarly, ADR growth is likely to continue given strong demand against a backdrop of record low domestic supply growth of net new rooms. As a result, 2024 RevPAR growth is likely to remain above long-term trends. For context, STR Global, the industry’s leading hospitality research firm, is projecting 2024 U.S. RevPAR growth of 4%, while international RevPAR growth is likely to be even stronger.
Hilton’s net unit growth is poised to accelerate in 2024 to ~6% or more. Hilton currently has the largest pipeline of rooms in the company’s history at 462,000, of which nearly half are under construction. This growth is supported by both existing and new brand concepts including Spark and LivSmart Studios by Hilton, a new exclusive partnership with Small Luxury Hotels of the World, and the recently announced acquisition of the Graduate Hotels brand.
Over the medium-term, Hilton stands to benefit from continued RevPAR growth (which historically grows at a premium to inflation), the acceleration of net unit growth back to Hilton’s historical industry-leading cadence of 6% to 7%, and continued strong growth from non-RevPAR fee earnings. Strong high-single-digit revenue growth combined with Hilton’s excellent cost control, high incremental margins, and substantial capital return program should drive robust earnings growth for the foreseeable future.
Howard Hughes (HHH)
HHH delivered strong business performance in 2023, highlighting the high-quality nature of its well-located master-planned communities (“MPCs”) and resilient business model.
In its land sales segment, the company generated a record $341 million in full-year profits. New home sales in HHH’s communities, a leading indicator of future land sales, increased an impressive 45% in 2023. The surge in new home sales continues to be driven by a significant shortage of resale housing inventory as existing homeowners are reluctant to give up their low-rate mortgages. This dynamic has led to robust homebuilder demand against a backdrop of limited supply of vacant lots in HHH’s MPCs. The resulting supply-demand imbalance has supported strong pricing growth with the company’s average price per acre for residential land sold exceeding $1 million in Q4 2023, up 22% year-over-year, a record-high milestone for the company.
HHH’s portfolio of income-producing operating assets have generated rental rate increases and strong leasing activity contributing to net operating income growth of 4% in 2023. This strong operating performance has enabled the company to navigate a challenging capital markets environment for real estate. In 2023, the company closed $659 million of financings, including approximately $500 million of construction loans across six new development projects.
In October 2023, HHH announced plans to spin-off its newly-formed Seaport Entertainment division, which will include the Seaport District in New York City, the Las Vegas Aviators baseball team and stadium, and the company’s ownership stake in Jean-Georges Restaurants. The company has appointed Anton Nikodemus, former President & COO of MGM CityCenter and an entertainment industry veteran with over 30 years of experience, as the CEO of Seaport Entertainment. We are optimistic Anton and his team will unlock significant embedded upside potential in Seaport Entertainment’s unique collection of assets. Moreover, we believe the planned separation will further establish HHH as a streamlined, pure-play MPC company.
HHH is in the early stages of its decades-long value creation opportunity, and we expect the company to become substantially more free-cash-flow generative in the coming years. Pershing Square purchased an additional 3.0 million shares of HHH in 2023 at an average price of $72 per share and now owns 38% of the company. We believe our purchase price represents a deep discount to the company’s intrinsic value given its uniquely advantaged business model and long-term growth prospects.
Canadian Pacific Kansas City (CP, “CPKC”)
CPKC is a high-quality, inflation-protected, unique North American railroad that operates in an oligopolistic industry with significant barriers to entry. In 2023, Canadian Pacific made history when it closed the acquisition of Kansas City Southern and renamed the combined company Canadian Pacific Kansas City, creating the only railroad with a direct route connecting Canada, the United States, and Mexico. This transformative acquisition will generate substantial long-term shareholder value as well as create competitive options for shippers and reduce greenhouse gas emissions by converting trucks to rail transportation.
In the 11 months since the acquisition closed, CPKC has already realized $350 million of run-rate revenue synergies, exceeding management’s expectations, despite a soft demand environment. Broad-based contract wins across end markets including chemicals, automotive, and cross-border intermodal demonstrate the attractiveness of the company’s unique service product.
CPKC is also ahead of plan on realizing cost synergies as the team successfully integrates the two networks after overcoming some operational challenges in Mexico. We believe CPKC is well on its way to achieving management’s goal to more than double the company’s earnings per share by 2028 while holding capital expenditures at current levels. We continue to believe that CPKC’s one-of-a-kind network and superb team are well positioned to deliver profitable long-term growth in the coming years.
Fannie Mae (FNMA, “Fannie”) and Freddie Mac (OTCQB:FMCC,”Freddie”)
Fannie Mae and Freddie Mac remain valuable perpetual options on the companies’ exit from conservatorship. There have been no material updates about the companies since our 2023 Semiannual Report.
Both entities continue to build capital through retained earnings which have increased their combined capital to $125 billion, what is already likely a fortress-level of capital. We continue to believe that the economic and political rationale for Fannie and Freddie’s independence remains intact. The U.S. Presidential election in November 2024 may present the opportunity for a change in the status quo. Both companies’ stock price increases in 2023 and year to date reflect optimism around a potential re-privatization in the event former President Trump is re-elected. The Trump administration had begun the process of releasing Fannie and Freddie from conservatorship, a process which would likely be completed in a future Trump administration.
Exited Equity Positions:
Lowe’s (LOW)
As discussed in the February Annual Investor Presentation, we exited our investment in Lowe’s (“LOW”) after a highly successful, nearly six-year holding period, thereby freeing up capital for new opportunities. Lowe’s is a high-quality business with significant long-term earnings growth potential that has been successfully executing a multi-faceted business transformation in recent years.
We initiated the position in 2018 on the thesis that Lowe’s refreshed board of directors would hire a world-class management team capable of closing the substantial operational and financial performance gap that then-existed relative to its direct competitor, Home Depot. We viewed the operating discrepancies with Home Depot to be largely a byproduct of poor focus and suboptimal management which could be fixed with excellent new leadership and renewed focus on operational excellence.
After initiating our position, Lowe’s hired Marvin Ellison as CEO, a superb, former senior-level operations executive from Home Depot. Marvin quickly assembled a refreshed team of world-class operators and merchants who have successfully executed a substantial operational transformation in recent years: (1) substantial share gains by Lowe’s in its professional and omnichannel markets, (2) five-year U.S. same-store sales growth of +32%, and (3) operating profit margin expansion of ~475bps (a 55% increase, with margins expanding from 8.6% to 13.3%). Lowe’s earnings have increased approximately ~2.6x over this period and its share price has responded accordingly, increasing 175% from our average cost at announcement date to our average sale price.
While we continue to maintain a positive outlook for Lowe’s long-term earnings prospects, we exited the position in late 2023 as we became concerned that volatile industry conditions created an uncertain near-term earnings trajectory, including downside risk to both Lowe’s same-store sales and earnings. In that context, we thought that Lowe’s valuation at the time of our sale largely reflected the company’s future financial prospects. Lowe’s subsequently guided towards another year of negative same-store sales and for earnings to decline in 2024.
We continue to monitor Lowe’s business prospects and believe the company is positioned to continue to succeed over the long-term. Lowe’s has been a highly successful investment for Pershing Square.
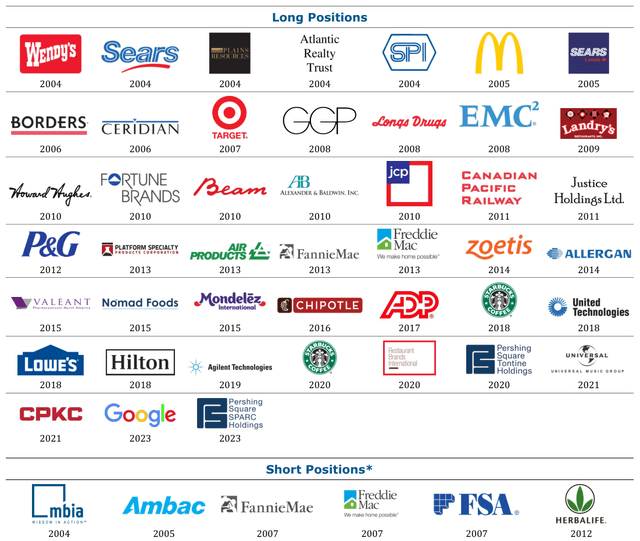
PUBLIC COMPANY ENGAGEMENT SINCE INCEPTION18
|
* Short Positions includes options, credit default swaps and other instruments that provide short economic exposure. Pershing Square has no current intention to initiate a public equity short position. The companies on this page reflect all of the portfolio companies, long and short, as of March 19, 2024, in respect of which (‘A’) Pershing Square or any Pershing Square Fund, as applicable, has designated a representative to the board, filed Schedule 13D, Form 4 or a similar non-US filing or has made a Hart-Scott Rodino filing; or (‘B’) Pershing Square has publicly recommended changes to the company’s strategy in an investment-specific white paper, letter or presentation. Past performance is not a guarantee of future results. All investments involve risk, including the loss of principal. Please see accompanying endnotes and disclaimers on pages 121- 125. ENDNOTES 1Performance results are presented on a net-of-fees basis. Net returns include the reinvestment of all dividends, interest, and capital gains from underlying portfolio companies and reflect the deduction of, among other things, management fees, brokerage commissions, administrative expenses and accrued and/or crystallized performance allocation/fees (if any). The Company has periodically engaged in share repurchases whereby its buyback agent has repurchased Public Shares subject to certain limitations. Any positive impact on the Company’s performance due to these share buybacks is reflected in the returns herein. The Company’s performance is based on the dollar return for the specific period, including any and all dividends paid by the Company, calculated from the beginning of such period to the end of such period. Where the Company’s performance is presented with that of PSLP, performance results assume that an investor (i) has been invested in PSLP since inception and has participated in any “new issues,” as such term is defined under Rules 5130 and 5131 of FINRA and (ii) invested in PSLP at its inception on January 1, 2004 and converted to PSH at its inception on December 31, 2012. Such performance information does not reflect either the performance of PSLP since its inception or PSH since its inception and no individual fund has actually achieved these results. The information is presented to illustrate how Pershing Square’s core strategy has performed over a longer time horizon prior to the inception of the Company and is not necessarily, and does not purport to be, indicative, or a guarantee, of future results. This performance provided is calculated based on certain inputs and underlying assumptions, but not all considerations may be reflected therein and such performance is subject to various risks and inherent limitations that are not applicable to the presentation of the performance of either PSH or PSLP alone. Although Pershing Square believes the performance calculations described herein are based on reasonable assumptions, the use of different assumptions would produce different results. For example, depending on the timing of an individual investor’s specific investment in the Company and/or PSLP, net performance for an individual investor may vary from the net performance as stated herein. The performance is also provided to you on the understanding that you will understand and accept the inherent limitations of such results, and will not rely on them in making any investment decision with respect to an investment with Pershing Square. 2PSLP’s net performance results are presented as it is the Pershing Square fund with the longest track record and substantially the same investment strategy to the Company. The inception date for PSLP is January 1, 2004. In 2004, Pershing Square earned a $1.5 million (approximately 3.9%) annual management fee and PSLP’s general partner earned a performance allocation equal to 20% above a 6% hurdle from PSLP, in accordance with the terms of the limited partnership agreement of PSLP then in effect. That limited partnership agreement was later amended to provide for a 1.5% annual management fee and 20% performance allocation effective January 1, 2005. The net returns for PSLP presented herein reflect the different fee arrangements in 2004, and subsequently. In addition, pursuant to a separate agreement, in 2004 the sole unaffiliated limited partner of PSLP paid Pershing Square an additional $840,000 for overhead expenses in connection with services provided unrelated to PSLP, which have not been taken into account in determining PSLP’s net returns. To the extent that such overhead expenses had been included as fund expenses of PSLP, net returns would have been lower. 3The S&P 500 Total Return Index (“index”) has been selected for purposes of comparing the performance of an investment in the Company or PSLP, as applicable, with a well-known, broad-based equity benchmark. The statistical data regarding the index has been obtained from Bloomberg and the returns are calculated assuming all dividends are reinvested. The index is not subject to any of the fees or expenses to which the Pershing Square Funds are subject. The Pershing Square Funds are not restricted to investing in those securities which comprise this index, their performance may or may not correlate to this index and they should not be considered a proxy for this index. The volatility of an index may materially differ from the volatility of the Pershing Square Funds’ portfolios. The S&P 500 is comprised of a representative sample of 500 U.S. large cap companies. The index is an unmanaged, float-weighted index with each stock’s weight in the index in proportion to its float, as determined by Standard & Poor’s. The S&P 500 index is proprietary to and is calculated, distributed and marketed by S&P Opco, LLC (a subsidiary of S&P Dow Jones Indices LLC), its affiliates and/or its licensors and has been licensed for use. S&P® and S&P 500®, are registered trademarks of Standard & Poor’s Financial Services LLC. © 2024 S&P Dow Jones Indices LLC, its affiliates and/or its licensors. All rights reserved. 4The performance data presented on page 2 under “Cumulative (Since Inception)” and “Cumulative (Since PSH Inception)” is calculated from January 1, 2004 and December 31, 2012, respectively. 5The Investment Manager’s Report contains Pershing Square’s own views and opinions, based on publicly available information, to illustrate Pershing Square’s thinking on the matters therein. An investment in the Company will entail substantial risks, and a prospective investor should carefully consider the risks described in “Principal Risks and Uncertainties” and the disclosures contained in Pershing Square’s Form ADV Part 2A and the Company’s Prospectus. 6NAV performance is presented as net returns. Please also refer to Endnote 3 and Endnote i of the Chairman’s Statement. 7The Company’s share price performance is calculated based on the Company’s Public Shares traded on Euronext Amsterdam and includes dividend reinvestment. Over the same periods, the share price performance, including dividend reinvestment, of Public Shares listed on the LSE in Sterling increased by 30.9%, 13.3% and 24.7%, respectively, and the share price performance, including dividend reinvestment, of Public Shares listed in USD increased by 31.1%, 10.8% and 32.2%, respectively. Discount to NAV is calculated based on the Company’s Public Shares traded on Euronext Amsterdam. Over the same period, the discount to NAV of Public Shares listed on the LSE in Sterling narrowed from 31.9% to 29.8% and the discount for Public Shares listed in USD narrowed from 32.1% to 29.6%. 8Please refer to Endnotes 1 and 3. 9Stock price performance reflects the Company’s NAV performance prior to its IPO and the NAV performance of PSLP prior to the inception of the Company. Please refer to Endnote1. The Company’s share return is calculated based on PSH’s Public Shares traded on Euronext Amsterdam and includes dividend reinvestment. 10Reflects the discount to NAV of the Company’s Public Shares traded on Euronext Amsterdam as of March 19, 2024. The discount to NAV for Public Shares listed on the LSE in Sterling and USD was 26.4% and 26.1% on that date, respectively. 11Pershing Square’s asymmetric hedging strategy refers to hedges that at initiation cost represent a low percentage of the capital of the Pershing Square Funds and which Pershing Square views as an opportunity to generate large multiples of capital. 12The contributions and detractions to performance presented herein are based on gross returns which do not reflect the deduction of management fees and accrued/crystallized performance fees (if any). Inclusion of such fees and expenses would produce lower returns than presented here. In addition, at times, Pershing Square may engage in hedging transactions to seek to reduce risk in the portfolio, including investment specific hedges that do not relate to the underlying securities of an issuer in which the Company is invested. For each issuer, the gross returns reflected herein (i) include only returns on the investment in the underlying issuer and the hedge positions that directly relate to the securities that reference the underlying issuer (e.g., if the Company was long Issuer A stock and also purchased puts on Issuer A stock, the gross return reflects the profit/loss on the stock and the profit/loss on the put); (ii) do not reflect the cost/benefit of hedges that do not relate to the securities that reference the underlying issuer (e.g., if the Company was long Issuer A stock and short Issuer B stock, the profit/loss on the Issuer B stock is not included in the gross returns attributable to the investment in Issuer A); and (iii) do not reflect the cost/benefit of portfolio hedges. Performance with respect to currency hedging related to a specific issuer is included in the overall performance attribution of such issuer. The contributors and detractors to the gross returns presented herein are for illustrative purposes only. The securities on this list may not have been held by the Company for the entire calendar year. All investments involve risk including the loss of principal. It should not be assumed that investments made in the future will be profitable or will equal the performance of the securities on this list. Past performance is not indicative of future results. Please refer to the net performance figures presented on page 2. 13Pershing Square’s 2020 CDS investment was selected to demonstrate how Pershing Square aims to invest during periods of market dislocation and not on the basis of performance. Periods of market dislocation are infrequent and present unique investment risks and opportunities, and it should not be assumed that Pershing Square or the Company will achieve comparable results to those of the 2020 CDS investment in the future. 14Twelve-year performance data is calculated from January 1, 2004 to July 31, 2015. PSLP performance data is used prior to the inception of the Company. Also refer to Endnote 1. 15Total returns for Lowe’s are calculated using the Pershing Square Funds’ average acquisition cost up to the date of the position’s announcement and the Pershing Square Funds’ weighted average sale price from trades made in the fourth quarter of 2023 and include dividends 16The Portfolio Update reflects Pershing Square’s own views and opinions as a shareholder of the portfolio companies discussed therein and should not be taken to reflect the view or opinions of the board of directors of any portfolio company or that of any individual director. 17Please refer to Endnote 12. This report reflects the contributors and detractors to the performance of the portfolio of the Company. Other than bond interest expense and share buyback accretion, positions with contributions or detractions to performance of 50 basis points or more are listed separately, while positions with contributions or detractions to performance of less than 50 basis points are aggregated. 18While the Pershing Square Funds often take an engaged posture with respect to certain investments, they will own, and in the past have owned, other investments, including passive investments and hedging-related positions. “Short Positions” includes options, credit default swaps and other instruments that provide short economic exposure. All trademarks are the property of their respective owners. It should not be assumed that any of the securities transactions or holdings discussed herein were or will prove to be profitable, or that the investment recommendations or decisions Pershing Square makes in the future will be profitable or will equal the investment performance of the securities discussed herein. Companies shown in this figure are meant to demonstrate Pershing Square’s experience engaging with public companies and the types of industries in which the Pershing Square Funds invest, and were not selected based on past performance. Limitations of Performance Data Past performance is not necessarily indicative of future results. All investments involve risk including the loss of principal. This report does not constitute a recommendation, an offer to sell or a solicitation of an offer to purchase any security or investment product. This report contains information and analyses relating to all publicly disclosed positions above 50 basis points in the Company’s portfolio during 2022. Pershing Square may currently or in the future buy, sell, cover or otherwise change the form of its investment in the companies discussed in this report for any reason. Pershing Square hereby disclaims any duty to provide any updates or changes to the information contained here including, without limitation, the manner or type of any Pershing Square investment. Forward-Looking Statements This report also contains forward-looking statements, which reflect Pershing Square’s views. These forward-looking statements can be identified by reference to words such as “believe”, “expect”, potential”, “continue”, “may”, “will”, “should”, “seek”, “approximately”, “predict”, “intend”, “plan”, “estimate”, “anticipate” or other comparable words. These forward-looking statements are subject to various risks, uncertainties and assumptions. Accordingly, there are or will be important factors that could cause actual outcomes or results to differ materially from those indicated in these statements. Should any assumptions underlying the forward-looking statements contained herein prove to be incorrect, the actual outcome or results may differ materially from outcomes or results projected in these statements. None of the Company, Pershing Square or any of their respective affiliates undertakes any obligation to update or review any forward-looking statement, whether as a result of new information, future developments or otherwise, except as required by applicable law or regulation. Original Post Editor’s Note: The summary bullets for this article were chosen by Seeking Alpha editors. |
Editor’s Note: This article discusses one or more securities that do not trade on a major U.S. exchange. Please be aware of the risks associated with these stocks.
Read the full article here