A Buy Rating for Silvercorp Metals Stock
To benefit from the rise in silver prices from the current $23.11 per ounce to $25.52/oz., which Trading Economics analysts predict within 12 months, retail investors may want to consider shares of the Canadian mining producer in China, Silvercorp Metals (NYSE:SVM) rather than a direct investment in the physical metal as the latter in most cases requires funds beyond the capability of retail investors.
To this end, the fast-growing, long-life, and extremely low-cost production in China’s big adopter in the world of silver-based solar panel technology to facilitate the energy transition defines a significant upside potential for the investment in SVM, as profits, which are the main driver of the stock price, will most likely be revised upward in anticipation of the next expected silver bull market.
The Outlook for Silver Prices
Silver prices are expected to experience a bull market: fearing devaluation effects on their portfolios due to the economic recession predicted to occur as early as 2024 by economists and the U.S. Treasury bond’s inverted yield curve, investors will flock to silver to take advantage of its safe haven properties against the headwinds. It is no coincidence that silver is considered the poor man’s gold. The scenario will create upward pressure on silver prices.
Prominent economists supporting the thesis of an economic recession as a result of the most aggressive interest rate hikes since the 2007-2008 financial crisis to curb the highest inflation in more than 40 years include Michael Pearce, the lead U.S. economist at Oxford Economics, Chryssa Halley, the CFO of the US Federal National Mortgage Association (Fannie Mae), and David Rosenberg, economist of Rosenberg Research. The former US Treasury Secretary’s voice was recently added to the choir. According to Larry Summers, a soft landing is unlikely, but a recession will occur in 2024.
The inverted US Treasury yield curve, with the one-year US Treasury yield currently exceeding the 10-year US Treasury yield (5.416% vs. 4.845%), continues to suggest a deterioration in the US economic cycle. Under normal circumstances, the one-year yield should be lower because a shorter term carries less risk of default and is therefore compensated by a lower yield. So, if, as GuruFocus.com’s chart shows, the 1-year yield is instead higher than the 10-year yield, then the short term is seen as riskier by investors, which could be a sign that bad weather is just around the corner.
Source: GuruFocus.com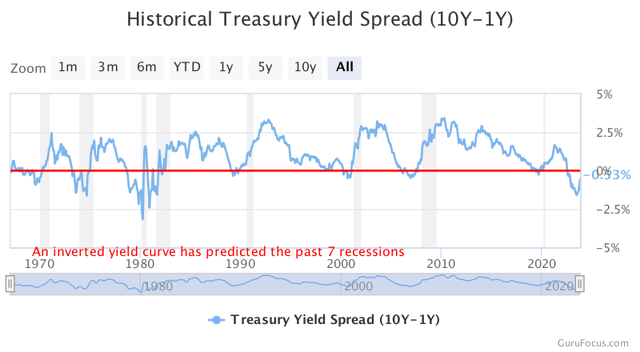
Silvercorp Metals and Its Relationship to the Market Price of Silver
The company also produces gold, albeit in small quantities, and other base metals that are vital in many sectors of the economy, such as the construction industry, which is a mainstay of the Chinese economy.
However, primary production consists of quantities of silver ounces, the price of which is measured in the below chart from Investing.com using silver futures (purple line).
So, a rising silver price should likely be followed by an increase in SVM’s share price, and the strong positive correlation that has existed between the two in the past, which is illustrated in the Investing.com chart in the section below with a completely gray area and above zero, allows this analysis to determine that the dynamics have a very high probability of producing the desired effect.
Source: Investing.com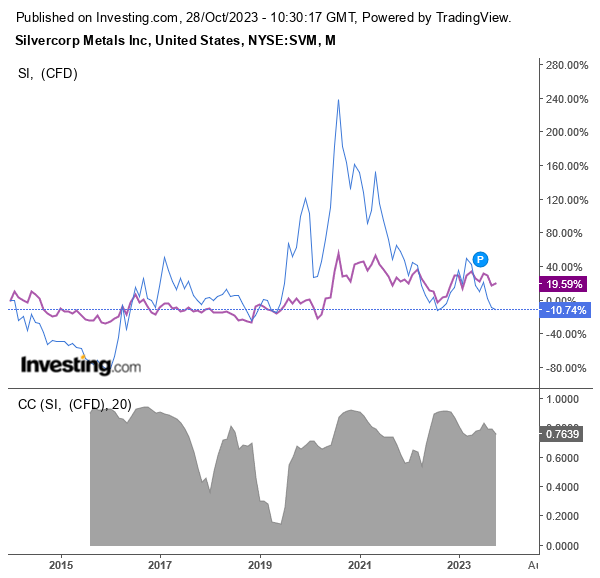
Based on a linear model where the SVM stock return over the past 52 weeks represents the output and the silver futures return over the past 52 weeks represents the input, the analysis concluded that the SVM stock will rise on average as much as the silver price.
The model has a coefficient of determination of approximately 40%, which is acceptable as a measure of the representativeness of the hypothesized relationship between silver and SVM. It means that the change in silver price determines 40% of SVM’s share price. The past 52 weeks were considered a sufficient period to study the cause-and-effect relationship, as markets are likely to look the same for the foreseeable future due to the impact of roughly the same geopolitical and macroeconomic conditions.
Silvercorp Metals’ Operations Are Located in China
Silvercorp Metals Inc. currently produces the metals from two underground mines in the People’s Republic of China:
- The Ying Project is located in the Ying Mining District of Henan Province.
During H1 of fiscal 2024 (ended September 30, 2023), the mine produced 3.103 million ounces of silver (down 7.5% YoY), 4,010 ounces of gold (up 74.3% YoY), 30.4 million pounds of lead (down 7.7% YoY), and 4.31 million pounds of zinc (up 10.4% YoY).
During the first quarter of fiscal 2024 (ended June 30, 2023), the mine produced 1.597 million ounces of silver, 1,552 ounces of gold, 15.382 million pounds of lead, and 2.113 million pounds of zinc.
Silver production increased 60.2% since the fourth quarter of fiscal 2023 (ended March 31, 2023) and was slightly lower compared to prior-year quarter when the miner produced almost 1.7 million ounces.
On a sequential basis, lead, zinc, and gold rose 59%, 81.5%, and 55.2% respectively. On a year-over-year basis, lead fell slightly by 8%, while zinc rose by 9.6% and gold rose by 41.1%.
Silver and lead production in the Ying Mining District was expected to be lower than last year due to temporarily lower grades in the producing deposit, consistent with the mining sequence and mineral reserves.
All-in sustaining cost per ounce of silver (AISC/oz.), net of by-product credits, was $7.14 in Q1-fiscal 2024, a significant improvement compared to the prior quarter when AISC/ounce was $11.33 and compared to the prior year quarter when AISC was $8.60.
- The Gaocheng (GC) mine is located in Guangdong Province.
During H1 of fiscal 2024 (ended September 30, 2023), the mine produced 267k ounces of silver (down 12.5% YoY), 3.481 million pounds of lead (down 16.2% YoY), and 7.112 million pounds of zinc (down 21% YoY).
The lower production was caused by disruptions as the local provincial government has been busy improving the local power grid infrastructure and therefore several companies in the same area, not just Silvercorp Metals, were affected by the temporary shutdown.
During the first quarter of fiscal 2024 (ended June 30, 2023), the mine produced 183k ounces of silver, 2.434 million pounds of lead, and 4.708 million pounds of zinc.
Silver production increased 68% since the fourth quarter of fiscal 2023 (ended March 31, 2023) and increased by 11.6% over the prior-year quarter when the miner produced 164k ounces.
On a sequential basis, lead and zinc rose 94.7%, and 95.1% respectively. On a year-over-year basis, lead rose slightly by 2.7%, while zinc declined slightly by 5.8%.
All-in sustaining cost per ounce of silver (AISC/oz.), net of by-product credits, was $9.51 in Q1-fiscal 2024, a deterioration compared to the prior quarter when AISC/ounce was $5.93 and compared to the prior year quarter when AISC was negative $7.48.
Supported by friendly Chinese legislation, particularly for the mining of energy transition metals, and aided by the presence of infrastructure and communications links, these mines have been able to bring over 90 million ounces of silver and more than 1.3 billion pounds of lead to the local market over the past 17 years, helping the company generate total profits of more than $520 million.
Source: Company’s October 2023 Presentation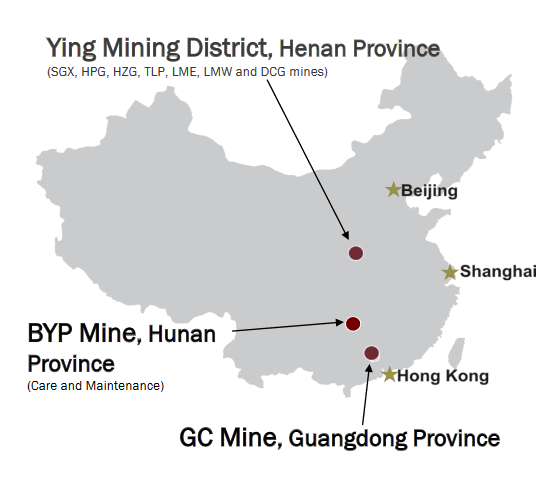
More than 2,605 km of successful drilling and more than 835 km of tunneling completed at Ying and GC since 2004 have defined a portfolio of operations that has outperformed both Silvercorp Metals Inc.’s most direct competitors and the overall silver mining industry for several years in terms of profitability.
Source: Seeking Alpha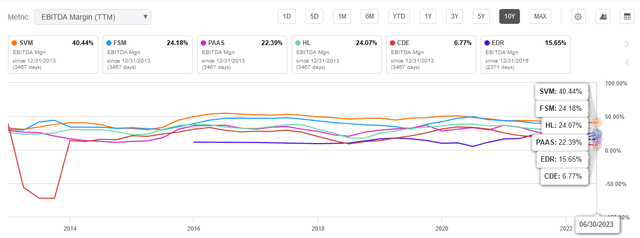
The screenshot from the company’s October 2023 presentation shows that Silvercorp Metals Inc. has almost always been a winner compared to an entire corporate sector represented by Vanguard Industrials Index Fund (VIS) and VanEck Gold Miners ETF (GDX).
Source: Company’s October 2023 Presentation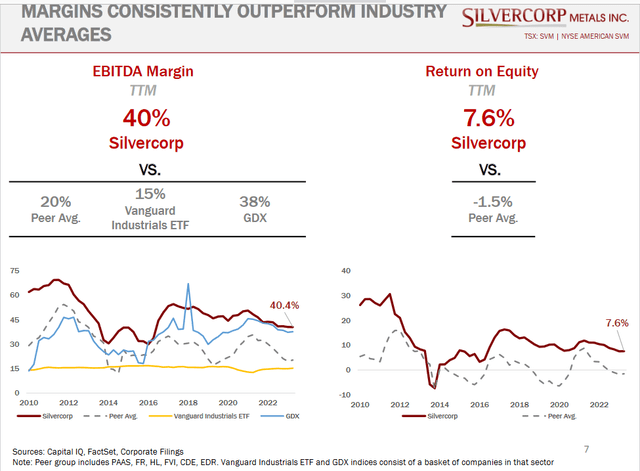
High returns from low-cost, debt-free silver equivalent and lead production generated consistent free cash flow over time, which Silvercorp Metals Inc. used to fund annual production growth, now targeting approximately 8 million equivalent ounces per year by fiscal 2026 (calendar year 2025) compared to the 6.6 million ounces produced in fiscal 2023.
Source: Company’s October 2023 Presentation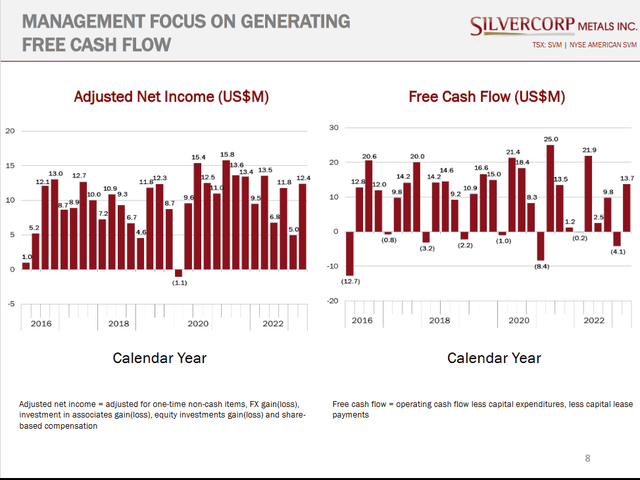
The Financial Condition and the Equity Investments Portfolio
As of June 30, 2023, Silvercorp Metals Inc.’s balance sheet looked strong, with $200.6 million in cash and short-term investments, while there was no debt.
The Altman Z Score of 4.51 (scroll down this Seeking Alpha page to the “Risk” section of this website) suggests that Silvercorp Metals Inc. has no chance of going bankrupt within a few years.
The Altman Z Score predicts the probability that a company will go bankrupt within a few years. A value below 1.8 means that the company is in financial distress and is likely facing bankruptcy. Companies with a score between 1.8 and 3 are grayed out and the risk of bankruptcy varies from moderately high to moderately low, while companies with scores above 3 are unlikely to go bankrupt.
The company also has shares in other companies, with the largest holding being a 27.5 percent stake in New Pacific Metals Corp. (NEWP) (NUAG:CA) equity worth about $75.83 million as of this writing. New Pacific Metals Corp is a Canadian exploration company in Bolivia whose projects, particularly the wholly-owned flagship Silver Sand project, which is targeting 14 years of mid-level production, have very interesting growth prospects as strong fundamentals are expected to keep silver prices above the historical average price of $21/oz.
The portfolio of equity investments also includes 15% of OreCorp Limited’s issued shares, but Silvercorp Metals Inc. wants to acquire 100% ownership of the Australian mineral explorer and the plan calls for Silvercorp Metals to pay A$0.15 in cash in addition to A$0.45 in Silvercorp share for each OreCorp share.
OreCorp. is the developer of the Nyanzaga gold project in the Lake Victoria goldfields of Tanzania. The target is to produce gold at a rate of 213,000 ounces per year and an AISC of approximately $954 per ounce. Or a total of 2.56 million ounces of gold over the entire operational life of the future gold deposit, which is estimated to be 12 years.
The Stock Valuation
As of this writing, Silvercorp Metals shares, $2.285 apiece, are trading:
- 25% below the 200-day simple moving average of $3.042.
- 14.1% below the 100-day simple moving average of $2.660.
- 5.5% below the 50-day simple moving average of $2.417,
As the chart below from Investing.com indicates.
Source: Investing.com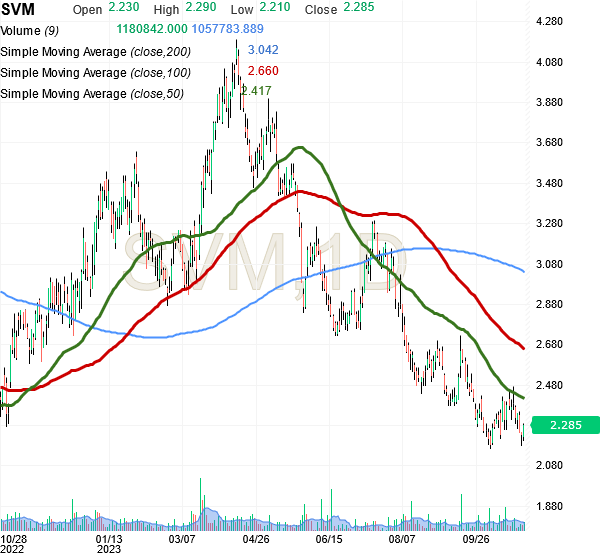
Shares have also fluctuated between a low price of $2.17 and a high price of $4.20 over the past 52 weeks, and currently, they are also significantly below the middle point of $3.185 of the 52-week range.
These prices are even historically low, while the company’s growth prospects are based on solid foundations.
Source: Seeking Alpha
Compared to the growth prospects analyzed in this article, shares are objectively cheaper, so retail investors may want to purchase stock in SVM from these price levels given the estimated bullish sentiment for the silver price.
However, shares could be getting cheaper as the following chart of the 14-day Relative Strength Indicator at 44.55 (versus the oversold level of 30) shows that there is still plenty of room for further downside.
Source: Investing.com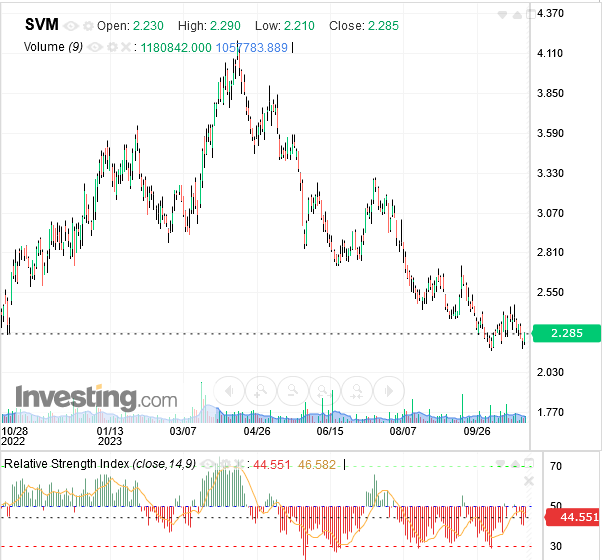
Although SVM shares have declined significantly since early April 2023 due to strong headwinds from China’s real estate sector, the Fed’s “higher for longer” interest rate stance may soon further tighten the environment for US-listed stocks and cause SVM shares to go down a little bit more. There is a strong chance of this scenario.
The annual “core” PCE ex. Food and Energy – the Federal Reserve’s preferred inflation indicator – remains robust and above the 2 percent target. Therefore, extra Fed rate hikes, as hinted at in the Fed Chair’s October 19 speech, are gaining momentum rather than tapering off.
Pending recessionary headwinds to act as a catalyst for higher silver prices, another rate hike, which does not bode well for US-listed stocks, could put strong downward pressure on SVM shares as well in the light of a 24-m beta market of 1.6x (scroll down this Seeking Alpha page to the “Risk” section of this website).
Retail investors may want to wait for a lower share price before implementing a buy rating.
Aswath Damodaran, professor of business economics and equity valuation at New York University’s Stern School of Business, says non-gold precious metals and minerals stocks should have an EBITDA multiple no higher than 6.97x to be considered fairly valued on the stock market.
Silvercorp Metals Inc. has the following Enterprise Value (EV) equation: The EV of $290.31 million is equal to the market cap of $401.54 million plus total debt of $531k, plus other of $83.55 million, minus cash of $200.60 million.
Source: Seeking Alpha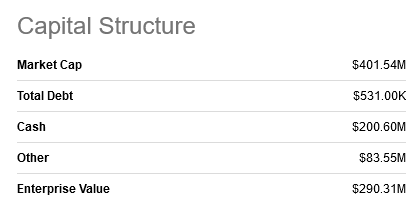
Silvercorp Metals Inc. has a TTM EBITDA of about $82.7 million leading to an EV/12-M EBITDA ratio of 3.5x, which is below Aswath Damodaran‘s threshold of fair value.
These market price levels could already provide an interesting entry point for SVM shares, but as the shares could get even cheaper, the retail investor may want to wait until more attractive entry points emerge.
There is a risk that shares will not get cheaper from current levels, but the Fed’s unfriendly attitude towards US-listed stocks makes that risk bearable for now.
The stock pays a dividend, but it is small, about $0.01 semi-annually per common share, which translates to an annualized dividend yield of 0.87% as of this writing.
The same considerations apply to shares of the stock in Silvercorp Metals Inc. traded on the Toronto Stock Exchange.
On the Toronto Stock Exchange, under the [TSX:SVM:CA] symbol, shares were trading at CA$3.15 per unit as of this writing for a market cap of CA$556.98 million. Shares are trading significantly below the 200-day simple moving average of CA$ 4.10 and below the 50-day simple moving average of CA$ 3.30.
Shares are also below the middle point of CA$ 4.285 in the 52-week range of CA$ 2.98 to CA$ 5.59. On top of this, the 14-day RSI’s trend of 46.4 suggests that shares have plenty of room for downside in a high-interest rate environment so there is a good chance they will be more compellingly appraised by the market for a Buy rating.
Conclusion
Shares of Silvercorp Metals Inc. have a “Buy” rating. but investors may want to hold off on implementing the rating for a little while as shares could become cheaper (relative to growth prospects) under the Fed’s “higher for longer” interest rate policy.
But this stock is definitely a buy, as its very strong portfolio of long-life, high-margin metals mining operations has laid a solid foundation to benefit dramatically from the expected bull market in silver prices.
The catalyst of the bull market will be the recession.
Read the full article here
