The summer rally is gone.
Not only is the S&P 500 (SP500) lower than where it stood on June 1, but on October 25, it closed less than 20% off its October 2022 intraday panic lows, the end of the “bull market.”
As noted, on a few occasions, the summer rally was likely to end badly and turn out to be one of the greatest bull traps in at least 25 years, possibly even longer than that.
Financial Conditions Drove The Rally
The summer rally was driven by the easing of financial conditions, which allowed a short volatility dispersion trade to develop, sending the S&P VIX Index (VIX) to levels not seen since before the pandemic while sending the 1-month S&P 500 correlation index to levels not seen since 2018. This allowed the top 7 stocks in the entire market to mask the overall weakening story beneath the stock market’s surface.
Bloomberg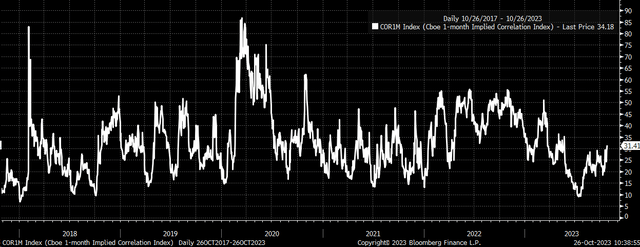
Given where we are in this cycle, we are unlikely to revisit the highs seen in July. The one condition that could lead to a strong rally would result from financial conditions easing again. However, given the Fed’s commitment to keeping rates restrictive for some time, and the massive move higher in long-end Treasury rates and the dollar over the past six months, along with the steepening of the yield curve, a return to the summer highs seems very challenged in 2023.
Times Have Changed
With long-end rates significantly higher, it is possible that we now enter a cyclical period where we begin to see multiple contracts. The same happened in 2002, following a 24% rally off the September 2001 lows. The multiple expanded from around 18 to around 22. Meanwhile, in 2023, the P/E of the S&P 500 expanded from about 16 at the October 2022 lows to about 20 at the July 2023 highs.
That rally in 2002 proved to be an epic bull trap, and it seems quite possible that if the higher rate and tighter financial conditions persist, we will see a similar type of multiple contraction in markets today, which could see multiples contract back to levels seen in October 2022. This would wipe out the summer gains and pull the S&P 500 well below 4,000.
Bloomberg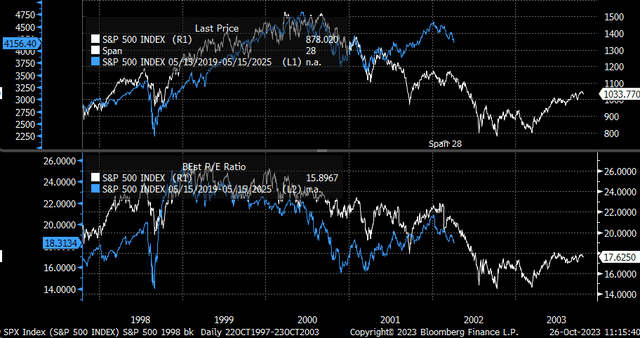
Credit Spreads Are Widening
The P/E ratio has plenty of room to contract because credit spreads are tight. Overall, the Bloomberg US Corporate High Yield Rate To Worst is 9.35%, while the US 10-year rate (US10Y) is 4.91%, and the spread is 4.43%. Compare that to the peak in the spread around 6.1% in October 2022, and it seems like high yield rates haven’t risen enough to keep up with the rise in Treasury rates, and unless the market now views Treasuries as more risky than junk bonds, rates on high yield debt should move higher.
Bloomberg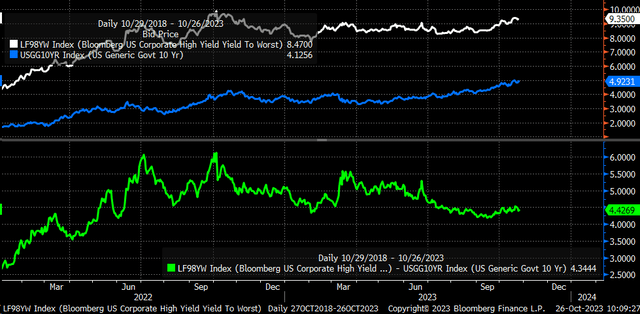
Understanding where the credit spreads are in the cycle is important to equity investors because the S&P 500 has been trading with credit spreads, and the wider credit spreads have gotten, the higher the S&P 500 earnings yield climbs, and the lower stock prices and the P/E ratio have gone. The CDX High Yield Index shows us how tightly the two have been trading together, which further supports the notion that the easing of financial conditions drove stocks higher this summer. When spreads narrow and the CDX index falls, financial conditions are easing.
Bloomberg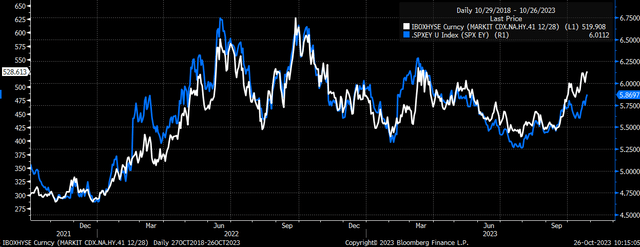
Higher and Tighter For Much Longer
At this stage of the game, and based on market-based expectations of where headline inflation will be, the risk is for the Fed to continue to tighten over the next six months. Because CPI swaps are currently pricing in headline inflation, remaining above 3%. Third quarter real GDP grew by 4.9%, while the GDP price index rose by 3.5%, up from 1.7%, implying that nominal GDP growth increased by 8.4% on a quarter-over-quarter seasonally adjusted annualized rate.
Bloomberg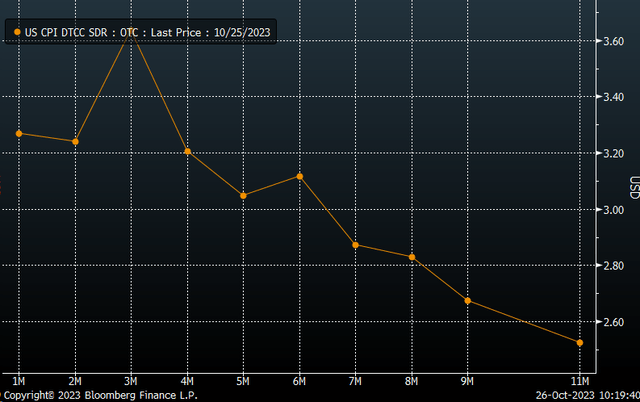
The strong growth and higher inflation expectations will result in the Fed leaving rates higher for longer and push back any hope of rate cuts. As a result, rates on the back of the Treasury curve could rise further while the yield curve steepens more, with the 10-year rising to the 2-year (US2Y). As long as that dynamic remains, we are also likely to see financial conditions tighten further as high-yield credit spreads push higher, the S&P 500 earnings yield climbs, and stock prices fall.
Bloomberg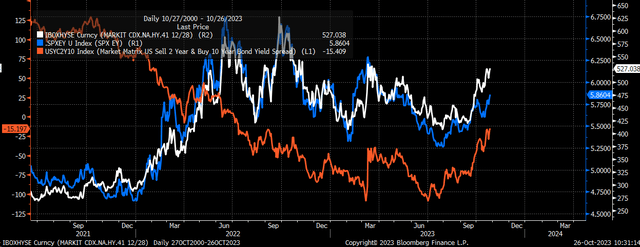
Technical Challenges
It isn’t only the macro forces that remain unfavorable, but from a technical perspective, the S&P 500 has not only fallen back below the August 2022 highs, but it has also now fallen back below the February 2023 highs after failing to push through resistance at the April 2022 highs. Based on this, the entire rally has turned into a failed break-out attempt, and worse, the uptrend of the October 2022 low has now been broken.
Trading View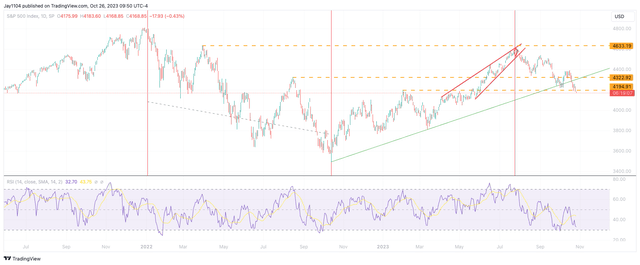
Whether the Fed initially let financial conditions ease following the SVB collapse in March or not, it doesn’t matter. Financial conditions eased a lot. That easing of financial conditions helped to drive the stock market higher. Financial conditions are no longer easing, and given the acceleration in the economy and with CPI expected to stay above 3%, the Fed will have to keep policy tight and ensure that financial conditions remain tight. As long that is the case, it will lead to higher implied volatility and lower P/E ratios, which translates to lower stock prices, which all but complete the massive bull trap from this past summer.
Read the full article here


