[Note: CAG’s fiscal year 2023 ended May 28, 2023]
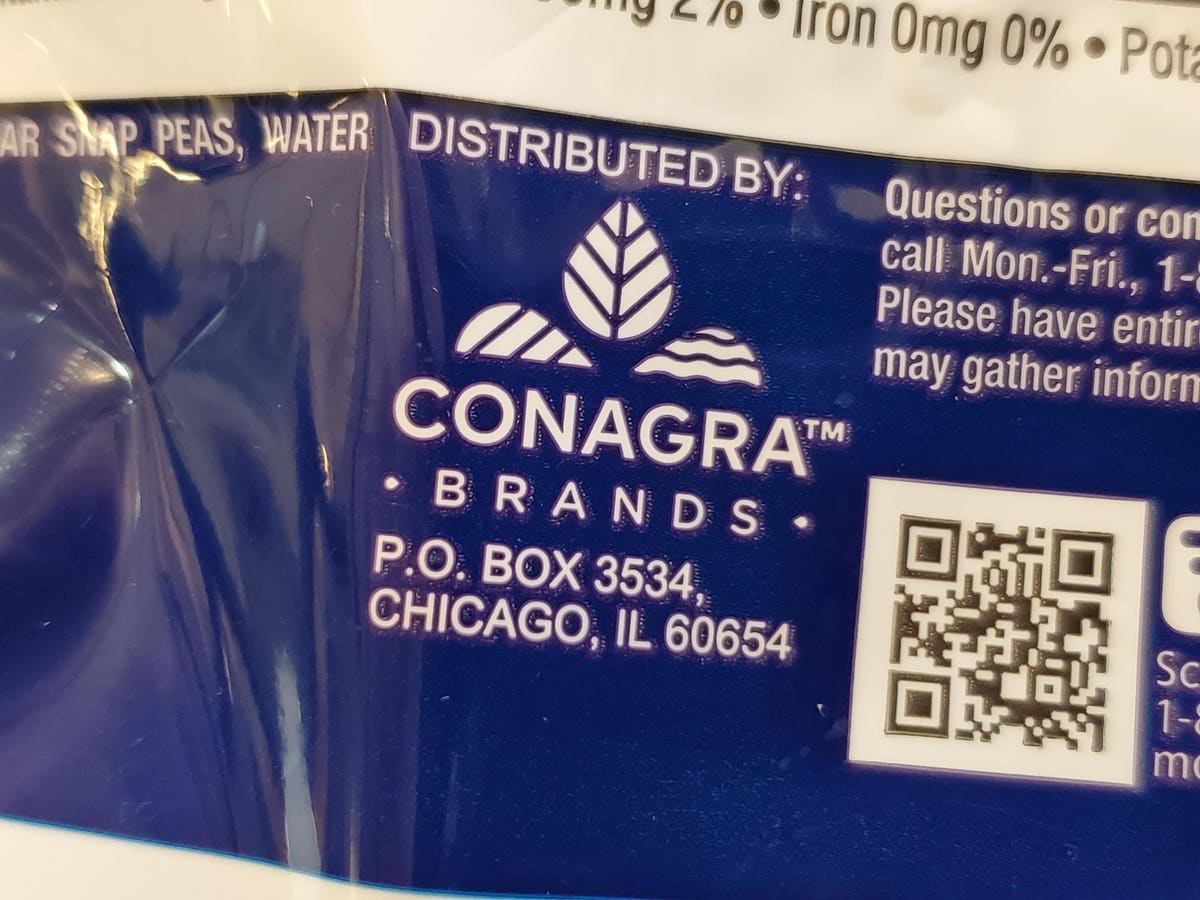
Conagra Brands (NYSE: CAG) engages in the manufacture and sale of processed and packaged foods. It operates through the following segments: Grocery and Snacks, Refrigerated and Frozen, International, and Foodservice. There are numerous brands owned by the company, including Hunt’s, Slim Jim, Marie Callender’s, and many others. The company’s stock currently trades at $27 per share, around 30% below its level of $39 seen on June 5, 2021 (pre-inflation shock high), and has the potential for gains. CAG saw its stock trading at around $31 on June 18, 2022, when the Fed kept increasing rates, and now remains down by about 13% from those levels. The retailer’s stock decline can be attributed to shifting consumer sentiment and slowing company sales. Despite a modest 10% rise in net sales over the past three years, net income has actually declined by nearly 50%. It should be mentioned that the company’s growth has been driven by pricing rather than the volume during this period.
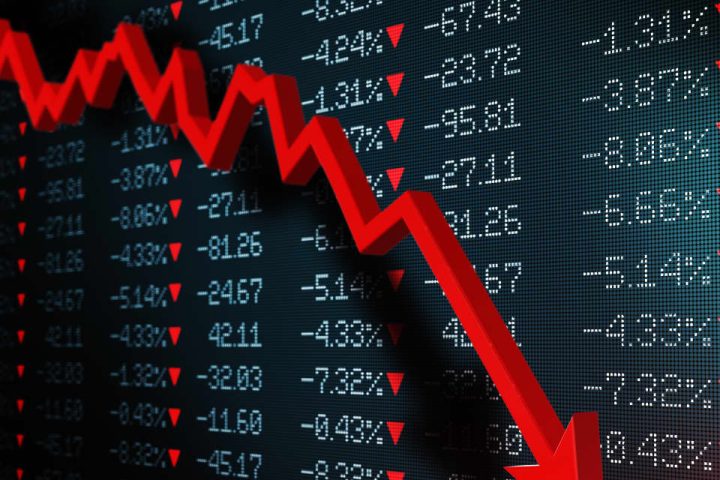
CAG stock has faced a notable decline of 30% from levels of $35 in early January 2021 to current levels, vs. an increase of about 15% for the S&P 500 over this roughly 3-year period. However, the decrease in CAG stock has been far from consistent. Returns for the stock were -6% in 2021, 13% in 2022, and -29% in 2023. In comparison, returns for the S&P 500 have been 27% in 2021, -19% in 2022, and 14% in 2023 – indicating an underperformance for the ticker in 2021 and 2023. In fact, consistently beating the S&P 500 – in good times and bad – has been difficult over recent years for individual stocks; for heavyweights in the Consumer Staples sector including WMT, PG, and COST, and even for the megacap stars GOOG, TSLA, and MSFT. In contrast, the Trefis High Quality Portfolio, with a collection of 30 stocks, has outperformed the S&P 500 each year over the same period. Why is that? As a group, HQ Portfolio stocks provided better returns with less risk versus the benchmark index; less of a roller-coaster ride as evident in HQ Portfolio performance metrics. Given the current uncertain macroeconomic environment with high oil prices and elevated interest rates, could CAG face a similar situation as it did in 2021 and 2023 and lose value over the next 12 months – or will it see a recovery?
Returning to the pre-inflation shock level means that CAG will have to gain about 42% from here. While it has the potential to recover to those levels, we estimate CAG’s Valuation to be around $27 per share, almost inline with the current market price. Our detailed analysis of Conagra upside post-inflation shock captures trends in the company’s stock during the turbulent market conditions seen over 2022 and compares these trends to the stock’s performance during the 2008 recession.
2022 Inflation Shock
Timeline of Inflation Shock So Far:
- 2020 – early 2021: Increase in money supply to cushion the impact of lockdowns led to high demand for goods; producers were unable to match up.
- Early 2021: Shipping snarls and worker shortages from the coronavirus pandemic continue to hurt the supply
- April 2021: Inflation rates cross 4% and increase rapidly
- Early 2022: Energy and food prices spike due to the Russian invasion of Ukraine. Fed begins its rate hike process
- June 2022: Inflation levels peak at 9% – the highest level in 40 years. S&P 500 index declines more than 20% from peak levels.
- July – September 2022: Fed hikes interest rates aggressively – resulting in an initial recovery in the S&P 500 followed by another sharp decline
- October 2022 – July 2023: Fed continues rate hike process; improving market sentiments help S&P500 recoup some of its losses
- Since August 2023: Fed keeps interest rates unchanged to quell fears of a recession, although another rate hike remains in the cards.
In contrast, here’s how CAG stock and the broader market performed during the 2007/2008 crisis.
Timeline of 2007-08 Crisis
- 10/1/2007: Approximate pre-crisis peak in S&P 500 index
- 9/1/2008 – 10/1/2008: Accelerated market decline corresponding to Lehman bankruptcy filing (9/15/08)
- 3/1/2009: Approximate bottoming out of S&P 500 index
- 12/31/2009: Initial recovery to levels before accelerated decline (around 9/1/2008)
CAG and S&P 500 Performance During 2007-08 Crisis
CAG stock declined from nearly $20 in October 2007 (pre-crisis peak) to around $11 in March 2009 (as the markets bottomed out), implying that CAG stock lost almost 42% of its pre-crisis value. It recovered from the 2008 crisis to levels of around $18 in early 2010, rising roughly 53% between March 2009 and January 2010. The S&P 500 Index saw a decline of 51%, falling from levels of 1,540 in September 2007 to 757 in March 2009. It then rallied 48% between March 2009 and January 2010 to reach levels of 1,124.
Conagra Brands
CAG
CAG revenues were almost flat from around $11.1 billion in FY 2020 (year ended March 2020) to about $11.2 billion in FY 2021, due to the impact of Covid-19. However, sales rose to $12.3 billion in FY 2023, as demand picked up further. Earnings per share grew from around $1.72 in FY 2020 to $2.67 in FY 2021 but fell hard to $1.85 in FY’22 and further down to $1.43 in FY’23. The reason for this decline was inflation curbing consumer spending and pushing up freight costs for the company.
Conclusion
With the Fed’s efforts to tame runaway inflation rates helping market sentiment, we believe CAG stock has the potential for strong gains once fears of a potential recession are allayed.
It is helpful to see how its peers stack up. CAG Peers shows how Conagra Brands’ stock compares against peers on metrics that matter. You will find other useful comparisons for companies across industries at Peer Comparisons.
Invest with Trefis Market Beating Portfolios
See all Trefis Price Estimates
Read the full article here