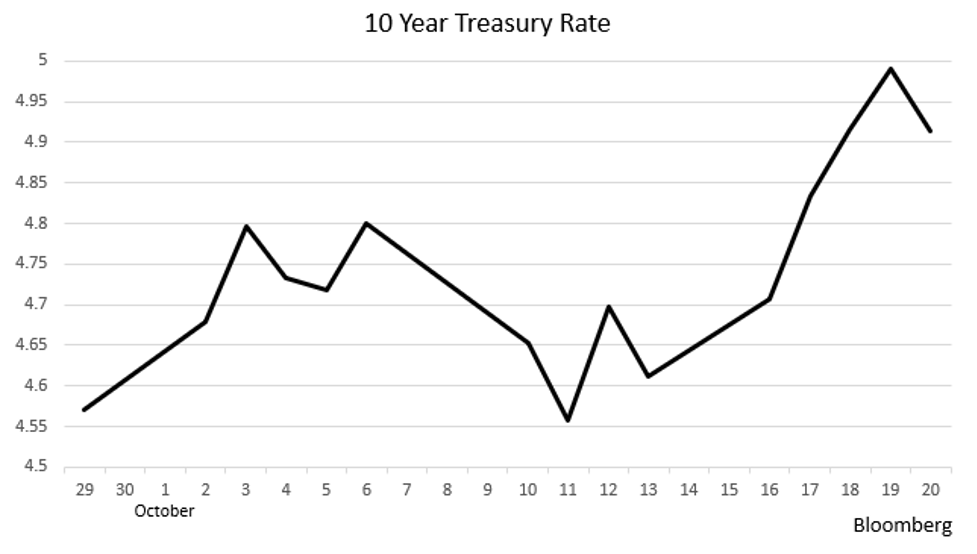
The relentless upward spike in interest rates continued this past week despite Fedspeak implying that the Fed will continue to be in “pause” mode, at least at the November 1st meeting. Rates on 10-Year Treasury Notes closed on Friday (October 20) at 4.91%. During the trading day, the 10-Year almost pierced the 5% level (4.995%) before retreating at the close (see chart). We think it is likely that a 5% handle will occur this coming week.
Earlier in the week, FOMC (Federal Open Market Committee) member Waller said that, since monetary policy acts with a lag, the Fed should “wait and see” what results occur from actions already taken. That was in line with several other recent FOMC speakers, and it is obvious that the Fed will stay “paused” at its upcoming meeting set. Powell and several other FOMC members have indicated that the up-spike in rates has clearly tightened financial conditions and its “doing the Fed’s job” for them.
This up-move in rates appears to be out of step. Less hawkishness is supposed to trigger lower, not higher rates. We did come across a Bloomberg article from October 18 titled “China Sells Most US Securities in Four Years…” The article said “the bulk of the $21.2 billion of sales were in Treasuries and US equities…” So, that may be part of the issue. But we think there is more to the story.
As we indicated in our last blog, the Middle East hostilities carry economic consequences. One of those, we think, is the rise in interest rates. Note the spike up in the chart coincides with the start of the middle east hostilities. With more risk in the world, we think that the “market risk premium,” (the “real” after inflation required return) has moved up; thus the rise in rates despite the Fed making it clear that they are still on “pause.”
While nearly all of the sentiment indicators are falling, the real data continue to paint a picture of an economy that is still chugging along. Of course, the most recent data are subject to revisions, most of which, of late, have been negative.
Take the jobs data: Initial unemployment claims are hovering around 200K. While that may, at first, appear to be a large number, it isn’t. It represents normal employment turnover. Yet, we are seeing layoff announcements rising. Challenger, Gray and Christmas say layoffs are up +58% from a year earlier and we’ve had some large layoff announcements. This past week (ending October 21) Nokia announced layoffs of -14K, Scotiabank -3% and Nestle -542 positions. Meanwhile the five largest banks (excluding JP Morgan) have laid off -20K so far in 2023, and we are told that the biggest cuts are yet to come. As a result, we expect rises in Initial Claims and the Unemployment Rate.
The consumer held up better than we thought in Q3. Real Retail Sales rose 1.7%, and we expect Q3 GDP, to be announced at month’s end, to be in the 4%-4.5% range. Some economists have pointed out that much of the buoyancy in those retail sales was due to something they called “excess savings,” a polite term for the $5 trillion of free money from pandemic fiscal policies. That “excess” was finally exhausted in Q3 they say (see right-hand side of the chart).
And we may now be seeing the first signs of a pull-back in spending. Redbook reported that same store sales fell -2.2% in the first half of October. In addition, in order to “keep up” with inflation, consumers have relied on their credit cards. If one normally fills up their gas tank by paying with a credit card, then higher gas prices raise the amount of the credit balance. Same with other retail purchases. There are three problems here:
- Consumers soon reach their maximum credit balance;
- The minimum monthly payment rises;
- This results in rising delinquencies.
To make matters worse, the banks have tightened lending, not only to consumers, but to businesses. This is sure to have an impact on economic growth going forward.
Sentiment Indexes
All the sentiment indexes are also downbeat. These indexes tell us the mood of businesses or consumers and give us a perspective on the future.
- The University of Michigan’s Consumer Sentiment Index fell to 63.0 in October from 68.1 in September. It is noteworthy that during Recessions, the average of this index is 71.4. The Expected Business Conditions sub-index for 2024 fell to 60 in October from 74 in September, a notable fall in the index’s history. And auto buying plans fell to 52 in October from 66 in August.
- The IMF (International Monetary Fund) cut global growth for 2024 to 2.9% from 3.2%. For China, they cut their 2024 growth forecast to 4.4% from 5.2%. Anything below 5% is normally associated with Recession in China.
- The Conference Board’s Leading Economic Indicators have fallen now for 18 months in a row (data just released). Per the chart, this many negative months in a row has never occurred without a Recession. The CEO Confidence Index fell to 46 in Q4 from 48 in Q3 (below 50 signals “contraction”). Expectations for the next six months were similar (43 in Q4 vs. 45 in Q3). And the wage growth survey indicated intentions of <3% wage growth in 2024.
- The University of Michigan’s monthly survey asks consumers about current conditions for buying homes and autos. The chart says it all! Because mortgage rates are now hovering near 8%, the consumers’ penchant for buying houses is now at or below those of the early 1980s. Note that conditions for buying vehicles are at near all-time series low (only lower during the pandemic).
On top of these sentiment indicators, we see that average weekly earnings are falling (-0.2% in September). They have been negative for three months in a row, in four of the last five, and, on a year over year basis, are flat (-0.1%).
Housing
The data continue to show weakness. Existing Home Sales were off another -2.0% in September, are down -15% from a year ago, and are at 13-year lows.
The Housing Affordability Index is now at a 47-year low for two reasons:
- 30-year Fixed Rate Mortgages are now in the 8% range;
- Most existing homeowners have a mortgage rate under 4%. Unless they are forced to move out of town (job change, for example), the incentive to sell is quite low (some commentators have described this as “prisoners in their own homes”). As a result, inventories are low, and prices, which would normally be falling in this kind of market, have held up (+0.3% in September from August) because inventories of homes for sale are thin.
Inflation
On the inflation front, once again we come back to BLS’ methodology. The chart below shows 1) the actual year over year percentage changes in multi-family rents (green) and 2) the shelter cost component of the CPI (orange). Because there is such a lag in BLS’ calculations, we know that rents are going to continue to fall. In addition, on the supply side, multi-family units under construction are at 50-year highs. Completions of those multi-family units were up 10% in September vs. August and are 15% higher than a year ago. So, a rapidly falling CPI shelter component (35% of the CPI and 45% of the Core CPI) is assured over then next year or so. Meanwhile, vacancy rates are rising.
Because we already know the data that will be going into the CPI calculation for shelter costs, the SF Fed’s recent forecast of headline and core inflation for the remainder of this year and into 2024 should be taken seriously, especially by the FOMC. The chart shows that by mid-2024, both Headline and Core CPI will be under 2%.
We say this with a great deal of confidence because, if one strips out BLS’s distorted shelter component, the year over year CPI is already under 2%!
Finally, China’s economy is likely in Recession. The chart shows that both their manufacturing PPI and their export prices are rapidly deflating. China plays a very large role in world trade.
Final Thoughts
- Interest rate spikes occurred in October. Some of it is likely due to supply issues (both new issuance and the sale of a significant amount of U.S. Treasuries by China). More importantly, we think much of the run-up is the result of a higher risk perception (requiring higher returns) due to the conflict in the Middle East.
- While the hard data still shows economic growth, our view is that we’ve missed the opportunity for a “soft landing,” and that a Recession has either already started or is imminent. Monetary policy is quite tight and the monetary aggregates are now negative on a year over year basis (first time historically). The real rate of inflation, with current shelter costs, is lower than the Fed’s 2% target. Note to Chairman Powell: Any hope of a “soft landing” would dictate that the Fed pivot now (not a chance of that). Powell & Co. appear more concerned about lagging and co-incident indicators than about the leading ones.
- Internationally, China appears to be in a Recession. That can only have a deflationary impact on the rest of the world.
(Joshua Barone and Eugene Hoover Contributed to this blog)
Read the full article here