With continuing growth in commercial aviation and defense spending, the aerospace and defense industry is poised to have a bright prospect. Today I would like to talk about General Dynamics (NYSE:GD), the company that I chose when I was screening the sector. The company promises great results and the expectations are for positive residual earnings for the years ahead. Through the accounting analyses and the latest quarterly results, I will try to forecast future revenues and returns to come up with my price target and explain why it is a “Buy” but with limited upside potential.
Choosing the company
It is interesting how I came to analyze this company. I was screening trailing P/E and P/B in the Aerospace and Defense industry and came up with 26 tickers that are based in the US.
|
Trailing P/E |
Trailing P/B |
||
| Median |
24.175 |
3.03 |
|
|
CDRE |
1 |
35.21 |
5.76 |
|
AIR |
2 |
31.52 |
1.83 |
|
TXT |
3 |
18.35 |
2.25 |
|
MOG.A |
4 |
23.43 |
2.31 |
|
HXL |
5 |
38.32 |
3.4 |
|
WWD |
6 |
39.48 |
3.78 |
|
CW |
7 |
25.08 |
3.73 |
|
AXON |
8 |
165.4 |
11.51 |
|
BWXT |
9 |
32.08 |
8.51 |
|
HWM |
10 |
35.96 |
5.01 |
|
NOC |
11 |
16.17 |
4.78 |
|
LMT |
12 |
16.12 |
11.98 |
|
GD |
13 |
19.79 |
3.38 |
|
RTX |
14 |
19.59 |
1.49 |
|
HII |
15 |
17.15 |
2.44 |
|
HEI |
16 |
57.84 |
7.8 |
|
LHX |
17 |
42.51 |
1.83 |
|
DCO |
18 |
24.92 |
1.11 |
|
VTSI |
19 |
12.1 |
1.43 |
|
OTCQB:BUKS |
20 |
11.4 |
1.12 |
|
CVU |
21 |
3.63 |
5.85 |
|
DRS |
22 |
11.8 |
2.28 |
|
ISSC |
23 |
26.91 |
3.67 |
|
NPK |
24 |
20.94 |
1.59 |
|
OPXS |
25 |
15.29 |
2 |
|
PKE |
26 |
29.18 |
2.68 |
Source: Author, with data from Seeking Alpha
Calculating the median P/B and P/E split the tickers between those that have high P/E and P/B (above median), low P/E and P/B (below median), and those that have a mix of high and low P/B or P/E.
| P/B | |||
| High | Low | ||
|
P/E |
High | CDRE, HXL, WWD, CW, AXON, BWXT, HWM, HEI, ISSC | AIR, LHX, DCO, PKE |
| Low | NOC, LMT, GD, CVU | TXT, MOG.A, RTX, HII, VTSI, BUKS, DRS, NPK, OPXS | |
Source: Author, with data from Seeking Alpha
You may see that the relationship is positive, companies with high P/E usually have high P/B, and the same is true for the low multiples. Thus 70% fell to this diagonal while the rest are on the other. I was interested in the companies that fell on other diagonal. GD has a low P/E compared to the median, but high P/B. At the same time, the company provides (as we will see further in the analysis) higher than normal P/B (more than 1) and normal trailing P/E (approx. 14.19), this suggests that the expectation for residual earnings are high, and future results should overcome current. The trailing P/E is an indicator of the difference between current and future profitability and usually, if the multiples are temporarily high or low, they are affected by unusual earnings, which is not the case in our situation.
Company Overview
General Dynamics is an aerospace and defense company which is based in Virginia and operates in four segments: Aerospace, Marine Systems, Combat Systems, and Technologies. As the healthcare sector was the beneficiary during the pandemic, now with conflicts in the World and rising defense spending, GD is the beneficiary of the current global situation and may continue to be for several years. It has a “Hold” Quant rating and “Buy” recommendations from both Wall Street and SA analysts. The company pays dividends with a forward yield of 2.2% resulting in a 1.75% 1-Year Total Return to its shareholders.
GD 1-Year Total Return (SeekingAlpha)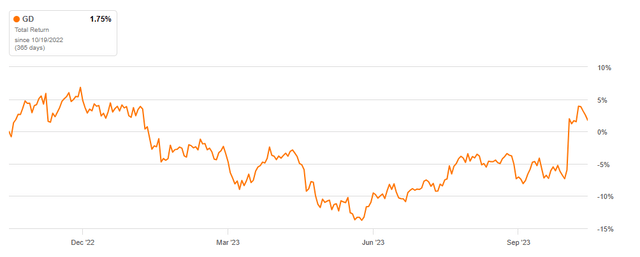
Peer analysis and industry trends
| GD | Sector Median | |
| P/E (FWD) | 18.64 | 19.21 |
| EV/Sales (FWD) | 1.75 | 1.61 |
| P/S (FWD) | 1.51 | 1.26 |
| P/B (FWD) | 3.2 | 2.33 |
| Div Yield (TTM) | 2.22% | 1.63% |
Source: Author, with data from Seeking Alpha
As may be seen from the table above, the company is lagging a bit in forward P/E compared to the sector`s median number. A higher EV/Sales multiple may suggest greater expectations for the revenues to increase. The dividend yield is higher than the median, providing further advantages for the value stock.
According to the Aerospace and Defense Global Market Report, the size of the market should grow by 7.5% CAGR in 2023. Needless to mention this figure was calculated taking into consideration the Russian-Ukraine war, but excluding new unexpected conflicts. Besides the pluses for the sector, it causes supply-chain disruptions and surges in commodity prices, resulting in rising inflation across the globe. Further growth of the market is expected to continue till 2027 at a CAGR of 5.9% and North America to be the fastest growing region.
Latest Quarterly Results
Second-quarter 2023 highlights (the company`s presentation)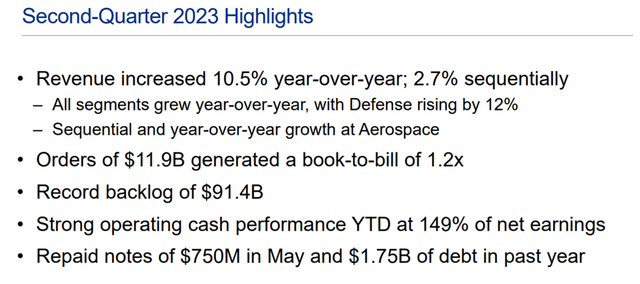
The company is going to publish its third-quarter results soon, but I published my article before as I believe it’s going to beat estimates. The second quarter was strong and surpassed the estimates.
|
Year |
1H 2023 |
1Q 2022 |
2022 |
2021 |
2020 |
2019 |
2018 |
|
Operating revenue |
100% |
100% |
100% |
100% |
100% |
100% |
100% |
|
Cost of sales |
85% |
83% |
83% |
83% |
83% |
82% |
81% |
|
Gross margin total |
15% |
17% |
17% |
17% |
17% |
18% |
19% |
|
Gross margin from products |
9% |
10% |
10% |
10% |
11% |
12% |
12% |
|
Gross margin from services |
7% |
7% |
7% |
7% |
6% |
6% |
7% |
|
Selling and administrative expenses |
6% |
7% |
6% |
6% |
6% |
6% |
6% |
Source: Author, with data from GD financial statements
Cost of sales increased, mainly due to the cost of sales of products thus resulting in lower gross margin. Still, the operating margin was not affected that much due to decreasing operating expenses. Revenues will continue to rise due to deliveries planned in 2023 and I will be not surprised if the company will improve its guidance.
|
1H 2023 |
1H 2022 |
2022 |
2021 |
2020 |
2019 |
2018 |
|
|
Operating assets |
|||||||
|
Cash and equivalents |
0% |
0% |
0% |
0% |
0% |
0% |
0% |
|
Accounts receivable, less allowance for doubtful accounts |
6% |
7% |
6% |
6% |
6% |
7% |
8% |
|
Inventories |
15% |
13% |
13% |
11% |
12% |
13% |
13% |
|
Other current assets |
3% |
2% |
3% |
3% |
4% |
2% |
2% |
|
Property, plant and equipment, net |
12% |
11% |
12% |
11% |
10% |
9% |
9% |
|
Goodwill |
40% |
41% |
40% |
41% |
41% |
41% |
44% |
|
Identifiable intangible assets |
3% |
4% |
4% |
4% |
4% |
5% |
6% |
|
Other non-current assets |
5% |
5% |
5% |
5% |
5% |
5% |
2% |
|
Total operating assets |
100% |
100% |
100% |
100% |
100% |
100% |
100% |
|
Operating liabilities |
|||||||
|
Accounts payable – non-interest bearing |
15% |
15% |
15% |
15% |
13% |
14% |
15% |
|
Accrued liabilities |
37% |
30% |
33% |
30% |
27% |
30% |
34% |
|
Income taxes payable |
14% |
15% |
15% |
17% |
17% |
15% |
16% |
|
Other liabilities |
35% |
40% |
38% |
38% |
43% |
41% |
35% |
|
Total operating liabilities |
100% |
100% |
100% |
100% |
100% |
100% |
100% |
Source: Author, with data from GD financial statements
The balance sheet structure didn’t change much, only inventories continued to rise I presume that it is affected by the ramp-up of the new Gulfstream aircraft production and the increased number of serviced planes, this fact is also confirmed by increased liabilities.
|
Year |
1H 2023 |
1H 2022 |
2023 |
2022 |
2021 |
2020 |
2019 |
|
Return On Common Equity (ROCE) |
10% |
8% |
17% |
29% |
23% |
24% |
21% |
|
Return On Net Operating Assets (RNOA) |
6% |
7% |
14% |
15% |
15% |
17% |
16% |
Source: Author, with data from GD financial statements
Return on net operating assets continued to be strong and I have almost no doubts that it will comfortably reach 14% booked last year.
GD EPS surprise & estimates by quarter (SeekingAlpha)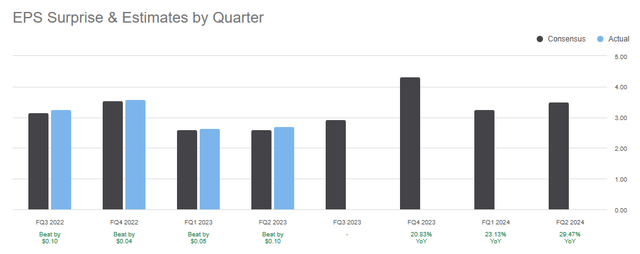
With a history of beating consecutive results in combination with rising defense spending (due to new conflicts that arose this quarter) and deliveries in coming quarters, I have almost no doubts about another good highlight.
Risks
The company is exposed to foreign exchange risks as some contracts are euro, Canadian dollar, and Swiss franc-denominated. Most of the contracts are fixed-price which may be affected by increasing costs for raw materials, transportation, and storage costs due to supply chain disruptions. 70% of revenues are coming from the US government making it highly dependent on defense spending. The aerospace segment is highly dependent on the availability and cost of credit, default of the client may affect significantly the segment’s revenue.
Valuation methodology
I used the same methodology as in my previous article. I forecasted balance sheets till 2027 to take into consideration the accelerated growth in sales due to increasing defense spending. The required return is WACC-calculated. Balance inputs depend on the sales figures of the company. Long-term growth rate is the average growth rate in revenues for 5 past years.
Valuation inputs and results
The required return is WACC-calculated and equals 7.58%, with a beta of 0.78 (60M) and borrowing costs weighted average after tax. I expect 2 more years of abnormal growth rate in revenues with further normalizing to its average of 2%. My revenue forecasts surpass the amount highlighted in the company`s presentation, but I used the numbers in the financial guidance, for the income tax federal statutory rate of 21% (provided from the annual statements) was used.
|
Year |
2022 |
2023E |
2024E |
2025E |
2026E |
2027E |
|
Return On Net Operating Assets |
14% |
14% |
14% |
14% |
14% |
14% |
|
Residual Operating Income (ReOI) |
1302 |
1807 |
1870 |
1963 |
2061 |
2103 |
|
Cost of operations |
7.58% |
|||||
|
Total Present Value (PV) of ReOI to 2023 |
7871 |
|||||
|
Continuing value (CV) |
61126 |
|||||
|
PV of CV |
42425 |
|||||
|
Net Operating Assets as of 2023 |
28140 |
|||||
|
Value of operations |
78436 |
|||||
|
Net Financial Obligations |
(9451) |
|||||
|
Value of common equity |
68985 |
|||||
|
Number of shares outstanding |
273 |
|||||
|
Value per share |
$252.69 |
In Millions of United States Dollar (USD) except per share items.
Valuation risks
The growth rate is outsourced from the company`s presentation, even a slight change will affect the price. If the growth rate continues to rise this year, it will result in a higher price target. Calculations don’t include options outstanding which will lower slightly the price target. Due to accounting principles, some of the figures I used in my reformulation might be slightly off, but I tried to minimize their influence. Some of the numbers in WACC calculations are outsourced but reasonably match my own. I assume that the revenue figures will be higher than suggested in the guidance which will result in higher valuation.
Conclusion
The valuation suggests that it is a “Buy” with my price target around $253 (which I presume will be surpassed, due to future earnings, that will probably beat the estimates) it gives a limited potential gain in price appreciation taking into consideration the current price. At the same time, I expect another beating quarter, suggesting short-term price swings and possible guidance upgrades which will result in higher valuation. It is a solid dividend-paying company with growth potential for some years in this unstable global situation.
Read the full article here