Consumer Discretionary
As the magnificent seven’s performance pushed the SP500 to a new all-time high, many sectors within the index are still below their all-time high. The consumer discretionary sector is still 4% below it’s all-time high, while the SP500 is 6.37% above it.
PRICE PERFORMANCE SECTORS (TRADINGVIEW)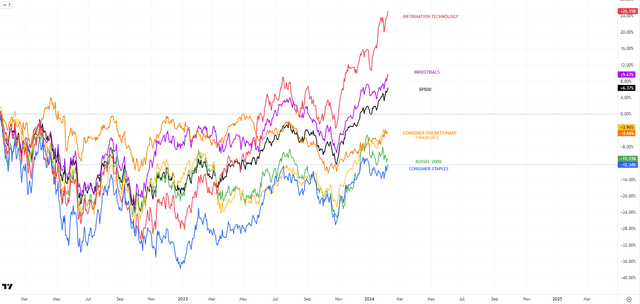
Consequently, the relative price to free cash flow ratio of the consumer discretionary sector compared to the SP500 was only lower than today in 2017 in the post great financial crisis period. This suggests the sector may be undervalued compared to the broader market, and it can be expected to close the gap sooner or later.
CONSUMER DISCRETIONARY TO SP500 PRICE TO FREE CASH FLOW (BLOOMBERG)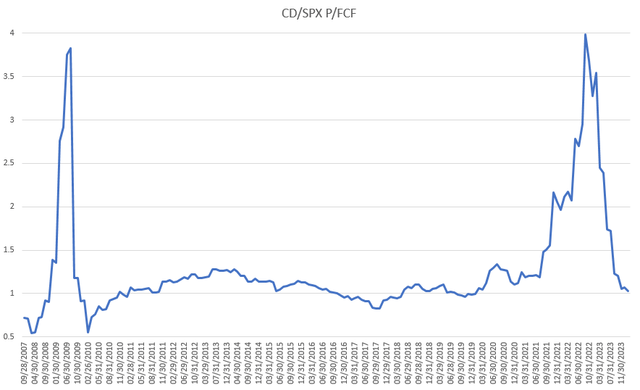
Nike
NIKE’s (NKE) price to free cash flow ratio is one of the cheapest in the past decade, currently sitting around 24. The multiple was only lower in 2020 and 2017 since 2023. This suggests Nike is currently trading at a great valuation from a historical perspective.
NIKE PRICE TO FREE CASH FLOW (BLOOMBERG)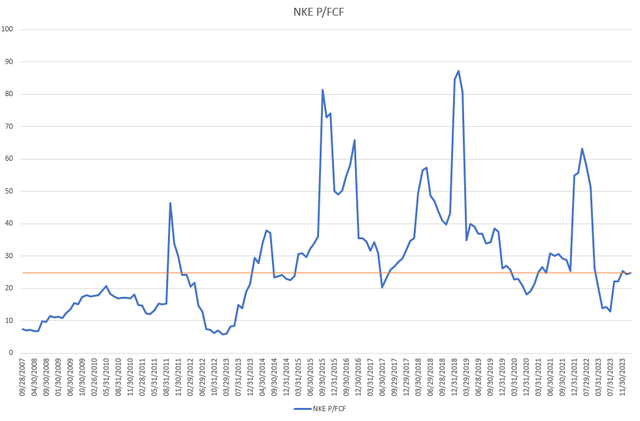
Nike’s relative price to free cash flow ratio compared to the consumer discretionary sector seems to be at the bottom of its historical range. This suggests Nike is likely undervalued compared to its sector from a historical perspective.
NIKE SECTOR RELATIVE PRICE TO FREE CASH FLOW (BLOOMBERG)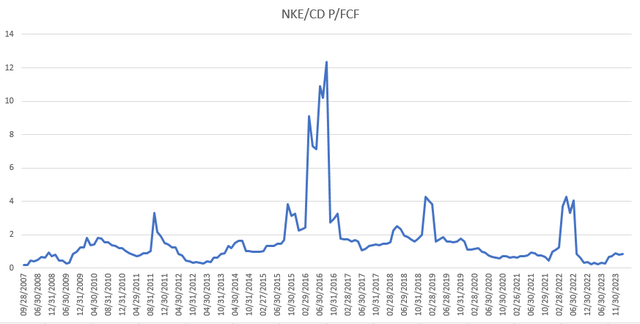
For Nike, 44% share of its revenue is deriving from the North American region while 28% from the EMEA region. Wholesale distribution represents 56% of the company’s sales while 44% goes through Nike direct. Footwear is the most important segment with 68% of revenue share while the apparels are giving 28% of sales.
NIKE SALES DISTRIBUTION (NIKE)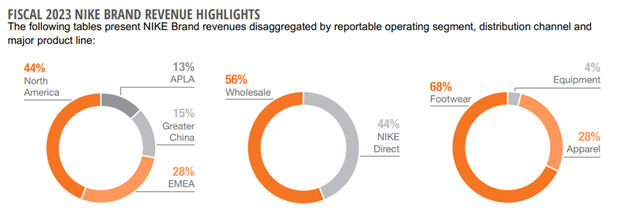
18% of the global sportswear market is captured by Nike, while Adidas has an 8.2% market share. Since 2019 Nike and Puma could strengthen their position, while Adidas lost market share.
SPORTSWEAR MARKET SHARE (REUTERS)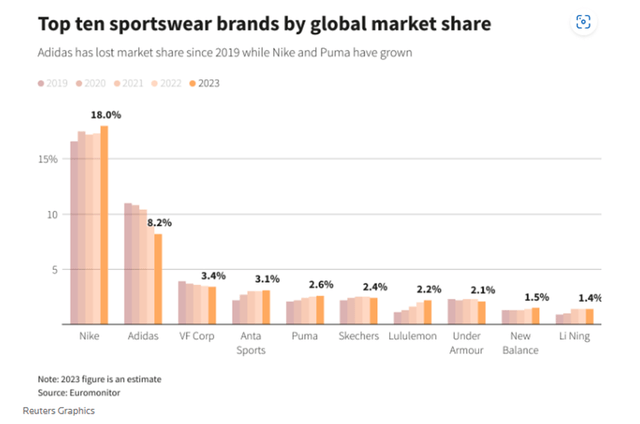
Nike clearly dominates the footwear market with sales of $29 billion, more than doubling the $13 billion of Adidas the second most prominent brand.
FOOTWEAR SALES (STATISTA)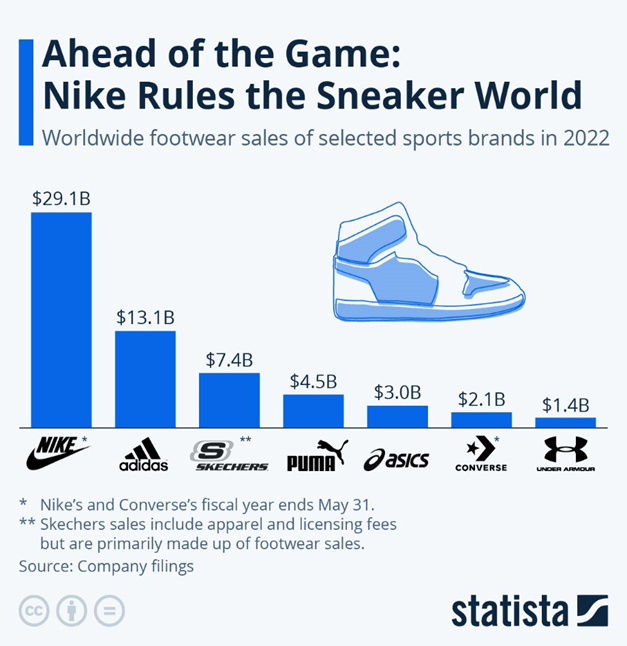
The simplified discounted cash flow analysis suggests Nike is currently 29% undervalued, given analysts expect a 9.15% annual free cash flow growth for the next three years. This number was averaged with the historical free cash flow growth rate of 8.49% since 2017, to project the future cash flows. That suggests a fair share price of 132.
NIKE DCF MODELL (BLOOMBERG)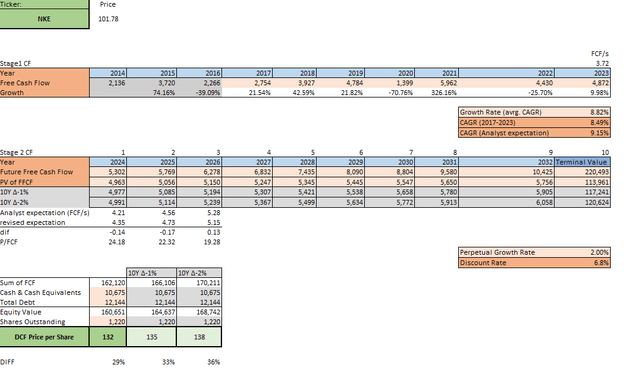
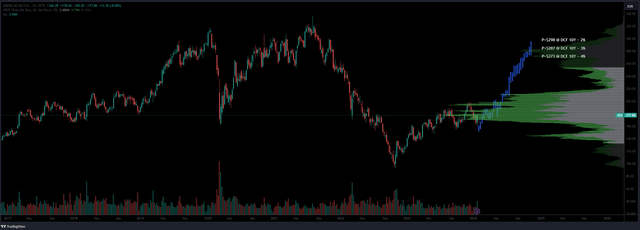
NIKE CHART AND PROJECTION (TRADINGVIEW)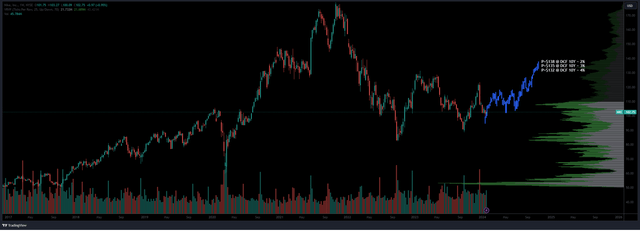
Adidas
adidas’ (OTCQX:ADDYY) price to free cash flow ratio is the cheapest since 2011, currently sitting around 22. The multiple was only lower after the great financial crisis. This suggests Adidas is currently trading at a great valuation from a historical point of view.
ADIDAS PRICE TO FREE CASH FLOW (BLOOMBERG)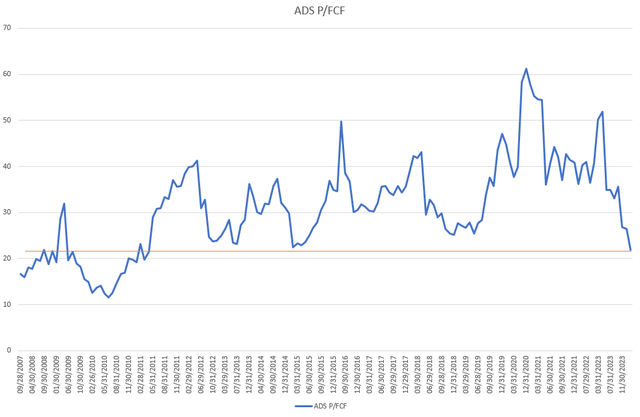
Adidas’s relative price to free cash flow ratio compared to the consumer discretionary sector seems to be at the bottom of its historical range. This suggests Adidas is likely undervalued compared to its sector from a historical perspective.
ADIDAS SECTOR RELATIVE PRICE TO FREE CASH FLOW (BLOOMBERG)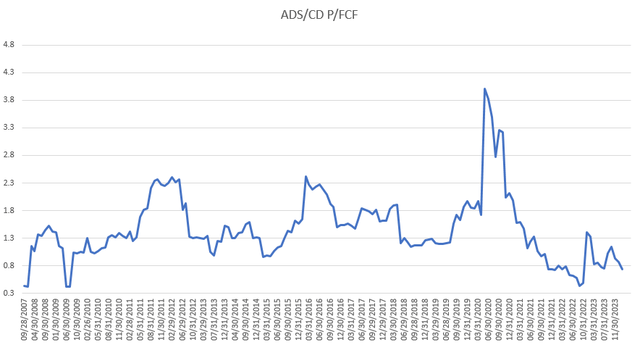
The simplified discounted cash flow analysis suggests Adidas is currently 66% undervalued, given analysts expect a 12.9% annual free cash flow growth for the next nine years. This number was averaged with the historical free cash flow growth rate of 2.49% since 2017, to project the future cash flows. This approach suggests a fair share price of 273.
ADIDAS DCF MODELL (BLOOMBERG) ADIDAS CHART AND PROJECTION (TRADINGVIEW)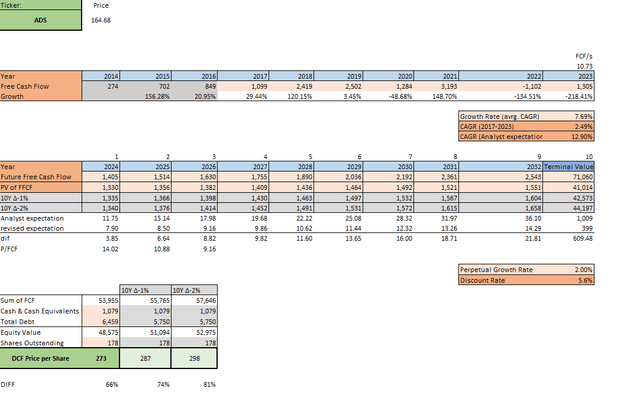
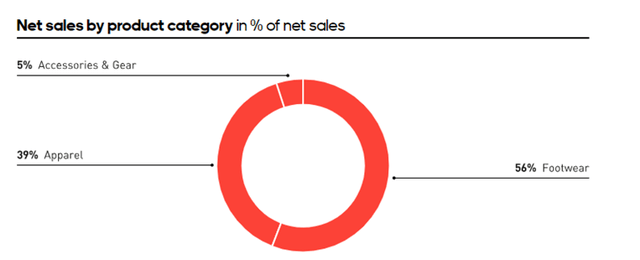
For Adidas , each of Asia-Pacific, North America and Europe regions contribute roughly 1/3 of its revenue. Footwear provides 56% of its sales, while Apparels represents 39% share.
ADIDAS SALES BY SEGMENT (ADIDAS) ADIDAS SALES BY PRODUCTS (ADIDAS)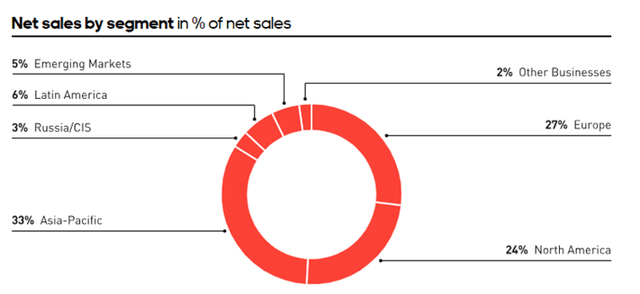
Relative Value
Assessing the relative valuation of the two companies, their price to free cash flow ratio shows that Nike and Adidas relationship sits in the middle of their historical range. That suggests neither of them seems to be under or overvalued compared to the other, and their relationship is fairly balanced.
NIKE ADIDAS RELATIVE PRICE TO FREE CASH FLOW (BLOOMBERG)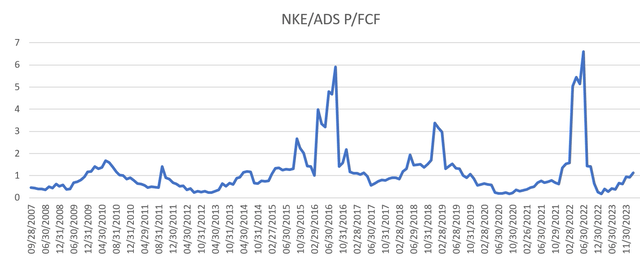
However comparing the undervaluation based on the discounted free cash flow analysis, Adidas seems to be trading at more than two times greater discount to its fair price than Nike.
DCF MODELL BELOW FAIR PRICE (BLOOMBERG)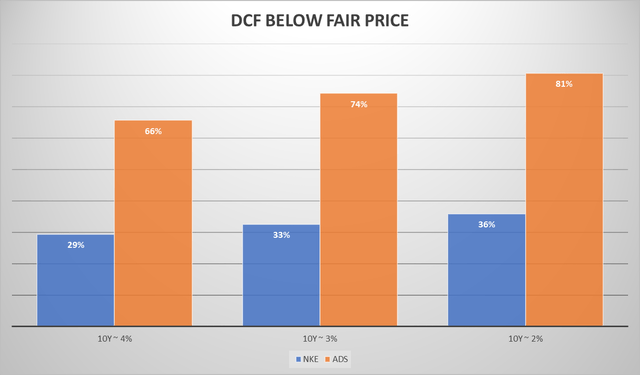
In terms of price action in the last 1 year, Adidas and Lulu Lemon are leading their peer group, while Nike sits in the middle. Puma and Under Armor are lagging but improving compared to Nike.
SECTOR RELATIVE ROTAION (BLOOMBERG)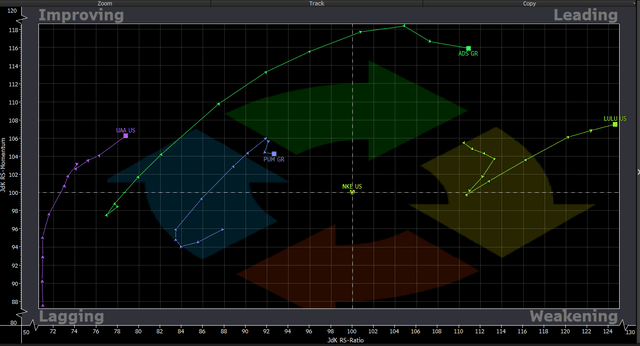
Statistical Performance
Since 1995, the historical average statistics suggest that both Nike and Adidas are trending upwards at least 8 months before and after the Olympics. On average, Adidas grows 30% while Nike grows 25% during the same 16 months period.
ADIDAS AND NIKE STATISTICAL PEROFRMANCE – OLYMPICS (BLOOMBERG)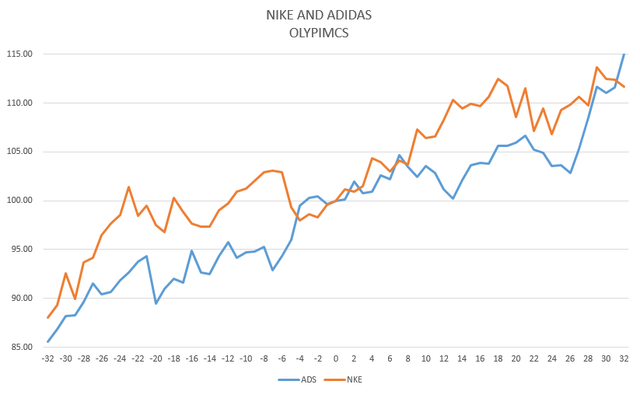
Similarly, both 8 months before and after the European soccer championship tends to be a positive period for both brands. During the same 16 months, Adidas historically rallied 18% while Nike grew by 16%.
ADIDAS AND NIKE STATISTICAL PEROFRMANCE – EUROPEAN CHAMPIONSHIP (BLOOMBERG)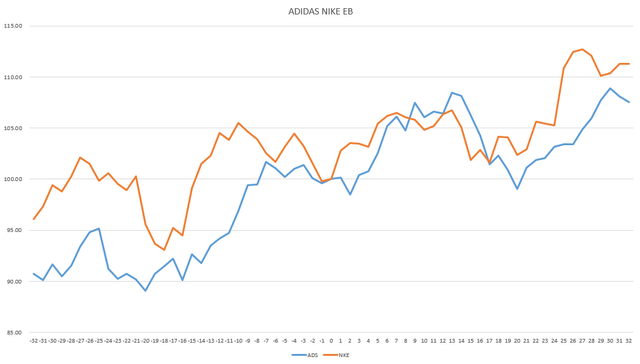
Conclusion
As in 2024 June the European soccer championship starts, and July the summer Olympics game, 2024 is supposed to be a strong period for both brands based on the historical relationship. The consumer discretionary sector appears to be undervalued compared to the SP500 and it is lagging behind in terms of price action, making it an attractive space to spot for opportunities. If inflation is indeed under control, and the interest rate trajectory is lower, the lagging sectors like discretionary may catch up to the broader market. Nike and Adidas both appear to be trading below it’s fair price estimate, and seems like undervalued from a historical perspective, therefore likely offers great value and opportunity in a statistically strong period.
Editor’s Note: This article discusses one or more securities that do not trade on a major U.S. exchange. Please be aware of the risks associated with these stocks.
Read the full article here